Introduction
The paired t-test is a powerful statistical method used to compare two related samples or measurements during hypothesis testing. This test is essential for researchers and analysts who need to determine whether there’s a significant difference between paired observations. The paired t-test is particularly useful when analyzing before-and-after scenarios or comparing two different treatments on the same group of subjects.
In various fields such as medicine, psychology, and business, the paired t-test plays a crucial role in decision-making processes. By using the paired t-test, researchers can confidently assess the effectiveness of interventions, treatments, or changes in conditions. This article will delve into the intricacies of the paired t test, explaining its application, interpretation, and significance in statistical analysis. Whether you’re a student, researcher, or professional, understanding the paired t-test is vital for conducting robust statistical analyses and drawing meaningful conclusions from your data
Unlock SPSS Mastery
Struggling with SPSS? Don’t let data analysis slow you down. Our expert team is ready to guide you through complex statistical procedures. Boost your research quality and save time. Contact us now for personalized SPSS assistance!
Understanding the Paired T-Test
The paired t-test, also known as the dependent samples t-test, is designed to analyze data from related samples. Unlike its counterpart, the independent t-test, the paired t test focuses on the differences between paired observations within a single group.
Concept of paired data:
In a paired t-test, each subject or unit has two related measurements. These pairs could be:
- Before and after measurements
- Matched pairs of subjects
- Two different conditions applied to the same subject
The paired t-test calculates the difference between these paired values for each subject and analyzes the average difference to determine if it’s statistically significant.
Assumptions of the paired t-test:
To correctly apply the paired t-test, certain assumptions must be met:
- The dependent variable should be continuous (interval or ratio level).
- The differences between pairs should be normally distributed.
- There should be no significant outliers in the differences between pairs.
- The sample should be randomly drawn from the population.
Differences from independent t-test:
While both the paired t test and independent t-test compare means, they differ in several ways:
- The paired t-test uses dependent samples, while the independent t-test uses independent samples.
- The paired t-test has higher statistical power as it controls for factors that cause variability between subjects.
- The paired t-test requires fewer subjects to detect a significant difference.
Understanding these fundamental aspects of the paired t-test is crucial for its correct application and interpretation in various research scenarios.
When to Use a Paired T-Test
The paired t-test is appropriate in numerous scenarios where two related sets of measurements are being compared. Here are some typical situations where a paired t test should be employed:
- Before and After Studies: When measuring the same variable on the same group before and after an intervention or treatment. For example, assessing blood pressure before and after a new medication.
- Repeated Measures: When the same subjects are tested under two different conditions. For instance, comparing reaction times of participants under caffeinated and decaffeinated conditions.
- Matched Pairs: When subjects are matched on certain characteristics, and each member of the pair receives a different treatment. An example would be comparing twin studies where one twin receives a treatment and the other doesn’t.
- Crossover Designs: In studies where subjects receive all treatments in a random order, with a washout period between treatments.
Examples from various fields where the paired t-test is commonly used include:
- Medicine: Comparing patient outcomes before and after a surgical procedure.
- Psychology: Assessing changes in anxiety levels before and after therapy sessions.
- Business: Evaluating employee productivity before and after implementing a new work policy.
- Education: Comparing student test scores before and after a new teaching method is introduced.
In all these cases, the paired t test helps researchers determine if the observed differences are statistically significant, providing valuable insights for decision-making and further research.
Steps to Conduct a Paired T-Test
Conducting a paired t test involves several key steps. Let’s walk through each one:
The first step is to state your null and alternative hypotheses.
- Null Hypothesis (H0): There is no significant difference between the paired observations (μd = 0, where μd is the mean difference).
- Alternative Hypothesis (H1): There is a significant difference between the paired observations (μd ≠ 0 for a two-tailed test, or μd > 0 or μd < 0 for one-tailed tests).
2. Calculating the test statistic:
To calculate the t-statistic, follow these steps:
- Calculate the differences between each pair of observations.
- Compute the mean of these differences (d̄).
- Calculate the standard deviation of the differences (sd).
- Use the formula: t = d̄ / (sd / √n), where n is the number of pairs.
The formula for the t-statistic is:
t = (mean of differences) / (standard error of differences)
3. Determining degrees of freedom:
For a paired t-test, the degrees of freedom (df) is always one less than the number of pairs:
df = n – 1, where n is the number of pairs.
4. Finding the critical value:
The critical value depends on your chosen significance level (α) and whether you’re conducting a one-tailed or two-tailed test. Use a t-distribution table or statistical software to find the critical value based on your df and α.
For example, if α = 0.05 and df = 29, the critical values for a two-tailed test would be approximately ±2.045.
5. Making a decision:
Compare your calculated t-statistic to the critical value(s):
- If |t| > critical value, reject the null hypothesis.
- If |t| ≤ critical value, fail to reject the null hypothesis.
Alternatively, you can use the p-value approach:
- Calculate the p-value associated with your t-statistic.
- If p < α, reject the null hypothesis.
- If p ≥ α, fail to reject the null hypothesis.
Example:
Suppose you’re testing the effectiveness of a new study method. You measure 30 students’ test scores before and after using the method. After calculating the differences and following the steps above, you find:
- t-statistic = 2.8
- df = 29
- α = 0.05
- Critical value (two-tailed) = ±2.045
Since 2.8 > 2.045, you would reject the null hypothesis and conclude that there is a significant difference in test scores after using the new study method.
Remember, while these steps provide the mechanical process of conducting a paired t-test, it’s crucial to ensure your data meets the test’s assumptions and to interpret the results in the context of your research question. Always consider practical significance alongside statistical significance when drawing conclusions.
Elevate Your Data Game
Transform raw data into meaningful insights with our SPSS support. Whether you’re a student or researcher, we’ll help you navigate statistical analyses with confidence. Don’t delay your breakthrough findings. Reach out today!
Paired T-Test Example in SPSS
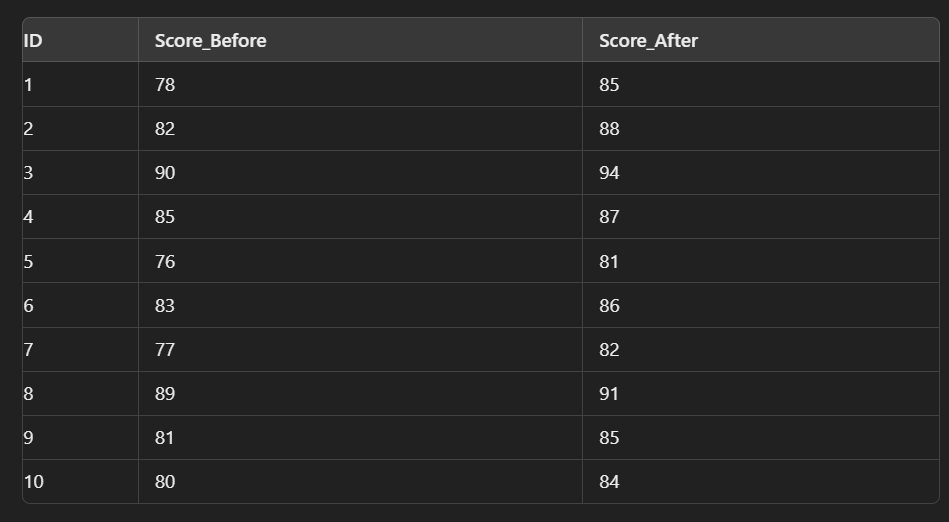
Imagine you are a researcher interested in determining whether a new teaching method improves test scores. You have test scores from 10 students before and after implementing the new method.
Steps to Perform a Paired t test in SPSS
1. Input Data:
- Open SPSS and enter your data in two columns: “Score_Before” and “Score_After.”
2. Run the Paired t-test:
- Click on
Analyze>Compare Means>Paired-Samples T Test. - Move “Score_Before” to Variable 1 and “Score_After” to Variable 2.
- Click
OK.
3. SPSS Output and Interpretation:
Example Output from SPSS
Paired Samples Statistics
| Mean | N | Std. Deviation | Std. Error Mean | |
|---|---|---|---|---|
| Pair 1 | Score_Before | 82.1 | 10 | 5.105 |
| Pair 1 | Score_After | 86.3 | 10 | 4.544 |
Paired Samples Correlations
| N | Correlation | Sig. | |
|---|---|---|---|
| Pair 1 | 10 | 0.945 | 0.000 |
Paired Samples Test
| Paired Differences | t | df | Sig. (2-tailed) | |
|---|---|---|---|---|
| Mean | Std. Deviation | Std. Error Mean | ||
| Pair 1 | 4.2 | 1.476 | 0.467 | 8.990 |
Interpretation of Results
1. Paired Samples Statistics:
- The mean score before the teaching method was 82.1, and after was 86.3.
- The standard deviation for
Score_Beforeis 5.105 and forScore_Afteris 4.544.
2. Paired Samples Correlations:
- The correlation between the scores before and after is 0.945, indicating a strong positive relationship.
3. Paired Samples Test:
- The mean difference between the scores before and after the teaching method is 4.2.
- The t-value is 8.990, and with 9 degrees of freedom, the p-value (Sig. 2-tailed) is 0.000.
Since the p-value is less than 0.05, we reject the null hypothesis and conclude that there is a statistically significant difference in the test scores before and after the new teaching method. This suggests that the new teaching method effectively improves students’ scores.
Template for Presenting Paired T-Test Results in APA Format
A paired-samples t-test was conducted to compare [variable] in [condition A] and [condition B]. There was a significant difference in the scores for [condition A] (M = [mean1], SD = [SD1]) and [condition B] (M = [mean2], SD = [SD2]) conditions; t([degrees of freedom]) = [t-value], p = [p-value].
[Optional effect size]: Cohen’s d was calculated as [d-value], indicating a [small/medium/large] effect size.
Here’s an example of how this template might be filled out:
A paired-samples t-test was conducted to compare student test scores before and after implementing a new study method. There was a significant difference in the scores for pre-intervention (M = 72.5, SD = 8.3) and post-intervention (M = 78.2, SD = 7.1) conditions; t(29) = 4.26, p < .001. Cohen’s d was calculated as 0.78, indicating a medium to large effect size.
Notes:
- Report the t-value to two decimal places.
- Report the p-value to three decimal places. If p < .001, report as “p < .001”.
- Means and standard deviations should be reported to one decimal place.
- Degrees of freedom are reported in parentheses after the t-statistic.
- Effect sizes can be reported as additional information. Cohen’s d values are typically interpreted as: small (0.2), medium (0.5), and large (0.8).
- If the difference is not significant, you would replace “There was a significant difference” with “There was no significant difference” and adjust the language accordingly.
Remember to also include a brief interpretation of these results in plain language following the statistical report.
SPSS Made Simple
Confused by SPSS? We’ve got you covered. Our step-by-step guidance will demystify statistical analysis and help you interpret results accurately. Stop second-guessing your data. Get expert SPSS help now and excel in your research!
Advantages and Limitations
The paired t-test offers several advantages that make it a valuable tool in statistical analysis:
Strengths of the paired t-test:
- Increased Statistical Power: By controlling for individual differences, the paired t-test can detect smaller effect sizes compared to independent samples tests.
- Efficiency: Fewer subjects are needed to achieve the same statistical power as unpaired tests.
- Control of Confounding Variables: The paired design eliminates many between-subject variables that could influence the results.
- Versatility: The paired t-test can be applied in various fields and experimental designs.
However, like any statistical method, the paired t test also has limitations:
Potential weaknesses and when not to use it:
- Assumption Violations: If the differences between pairs are not normally distributed, the paired t-test may not be appropriate.
- Limited to Two Conditions: The paired t-test can only compare two related groups. For more than two conditions, other tests like repeated measures ANOVA should be used.
- Order Effects: In before-and-after studies, the order of measurements might influence results.
- Inability to Generalize: Results from a paired t-test may not always generalize to unpaired situations.
Understanding these advantages and limitations is crucial for researchers to determine when the paired t-test is the most appropriate statistical method for their data analysis.
Real-World Applications
The paired t test finds extensive use across various disciplines, providing valuable insights in real-world scenarios. Let’s explore some case studies that demonstrate its practical application:
Medical Research:
- In a study on the effectiveness of a new antihypertensive medication, researchers conducted a paired t-test to compare patients’ blood pressure before and after a month of treatment.
- The test revealed a statistically significant decrease in blood pressure, supporting the drug’s efficacy.
Psychology:
- A psychologist investigated the impact of mindfulness meditation on stress levels. Using a paired t-test, they compared participants’ cortisol levels (a stress hormone) before and after a six-week meditation program.
- The analysis showed a significant reduction in cortisol levels, suggesting the effectiveness of mindfulness in stress management.
Education:
- An educational researcher examined the effect of a new teaching method on student performance. They used a paired t-test to compare students’ test scores before and after implementing the new approach.
- The results indicated a significant improvement in scores, supporting the adoption of the new method.
Sports Science:
- In a study on athletic performance, researchers used a paired t-test to compare athletes’ sprint times before and after a new training regimen.
- The test revealed a significant decrease in sprint times, demonstrating the training’s effectiveness.
Environmental Science:
- Scientists studying air quality used a paired t-test to compare pollution levels before and after implementing new emissions regulations.
- The analysis showed a significant reduction in pollutants, supporting the effectiveness of the new policies.
In each of these cases, the paired t-test provided a robust method for analyzing the data and drawing meaningful conclusions. By comparing related samples, researchers were able to control for individual differences and isolate the effect of the intervention or treatment. This approach enhances the validity of the findings and provides stronger evidence for decision-making in various fields.
Common Mistakes and How to Avoid Them
When conducting a paired t-test, researchers should be aware of common pitfalls that can compromise the validity of their results. Here are some frequent mistakes and strategies to avoid them:
- Data Collection Errors:
Mistake: Inconsistent measurement techniques or timing between paired observations.
Solution: Standardize data collection procedures and ensure consistent timing for all measurements. - Mismatched Pairs:
Mistake: Incorrectly pairing data points or mixing up before-and-after measurements.
Solution: Implement a robust system for tracking and matching paired observations, such as unique identifiers for each subject. - Ignoring Outliers:
Mistake: Failing to identify and address extreme differences between pairs.
Solution: Conduct thorough data screening to detect outliers and investigate their causes before deciding whether to include or exclude them. - Violating Normality Assumption:
Mistake: Applying the paired t-test when the differences between pairs are not normally distributed.
Solution: Check the distribution of differences using normality tests or visual methods. Consider non-parametric alternatives if the assumption is violated. - Misinterpreting P-values:
Mistake: Overreliance on p-values without considering effect sizes or practical significance.
Solution: Report and interpret effect sizes alongside p-values to provide a more comprehensive understanding of the results. - Neglecting Sample Size Considerations:
Mistake: Using too small a sample size, leading to low statistical power.
Solution: Conduct a power analysis before the study to determine the appropriate sample size.
By being aware of these common mistakes and implementing preventive measures, researchers can ensure the accuracy and reliability of their paired t test analyses, leading to more robust and trustworthy conclusions.
Paired T-Test vs. Other Statistical Tests
While the paired t-test is a powerful tool for analyzing related samples, it’s essential to understand how it compares to other statistical tests and when to choose alternatives. Let’s explore some comparisons:
Paired T-Test vs. Wilcoxon Signed-Rank Test:
The Wilcoxon signed-rank test is a non-parametric alternative to the paired t-test. Key differences include:
- Assumptions: The paired t-test assumes normally distributed differences, while the Wilcoxon test doesn’t require this assumption.
- Data Type: The paired t-test is used for continuous data, while the Wilcoxon test can be used for ordinal data as well.
- Power: The paired t-test is generally more powerful when assumptions are met, but the Wilcoxon test is more robust when assumptions are violated.
When to choose: Use the Wilcoxon test when the differences between pairs are not normally distributed or when working with ordinal data.
Paired T-Test vs. Repeated Measures ANOVA:
Repeated measures ANOVA is used when comparing more than two related groups. Key differences include:
- Number of Groups: The paired t-test compares two groups, while repeated measures ANOVA can handle three or more.
- Complexity: Repeated measures ANOVA can account for multiple factors and interactions, while the paired t-test is simpler.
- Post-hoc Analysis: ANOVA requires additional post-hoc tests to determine which specific groups differ, while the paired t-test directly compares the two groups.
When to choose ANOVA: Opt for repeated measures ANOVA when you have more than two related groups or need to analyze multiple factors simultaneously.
Paired T-Test vs. Independent T-Test:
The independent t-test is used for comparing two unrelated groups. Key differences include:
- Sample Relationship: Paired t-test for related samples, independent t-test for unrelated samples.
- Statistical Power: Paired t test generally has higher power due to controlling for individual differences.
- Degrees of Freedom: Paired t-test has n-1 degrees of freedom, while independent t-test has n1+n2-2.
When to choose: Use the independent t-test when comparing two unrelated groups or when pairing is not possible or relevant.
Understanding these differences helps researchers select the most appropriate statistical test for their specific research design and data characteristics.
Accelerate Your Research
Time is precious in research. Let our SPSS specialists handle the complex statistical analyses while you focus on your core study. Streamline your workflow and get reliable results faster. Contact us now to speed up your research!
Conclusion
The paired t-test is a versatile and powerful statistical tool for analyzing related samples across various fields. By understanding its applications, assumptions, and limitations, researchers can effectively use this test to draw meaningful conclusions from their data. Whether comparing before-and-after scenarios, evaluating treatments, or assessing interventions, the paired t test provides valuable insights into the significance of observed differences. As with any statistical method, it’s crucial to apply the paired t-test correctly, interpret results cautiously, and consider alternative tests when appropriate. Mastering the paired t test enhances a researcher’s ability to conduct robust analyses and contribute to evidence-based decision-making in their respective fields.