This an example of results chapter written by our experts. For similar dissertation tasks based on your instructions, you can order from here.
Results
The determination of the results which would be used to provide necessary answers for the research questions for this project, the collected data were analysed using the Statistical Package for the Social Sciences (SPSS). The data was collected from 34 participants who had the lowest age of 18 years and the highest age of 26 years. The results from the SPSS analysis of the collected data indicated that the average age value of the participants was 21 years while the standard deviation of the age of the participants had a value of 2.4. The same process was also used in the analysis of the height and weight of the participants, and the results indicated that the average weight of the participants was 87.6 and the standard deviation of the weight being 6.7. On the other hand, the average height was determined to be 182.2 while the standard deviation of the height being 6.7. The study further determined the major differences between the offensive and defensive players. The average BMI of the offensive players was determined to be 25.7, with the average waist circumferences being recorded at 60.6. On the other hand, the average BMI and waist circumference of the defensive players was determined to be 26.8 and 88.2respectively.
The Average and Standard Deviation Values of Age, Weight and Height of the Participants
| Variables | Results |
| Average Age | 21 |
| Standard Deviation of Age | 2.4 |
| Average Weight Kg | 87.6 |
| Standard Deviation of Weight Kg | 7.6 |
| Average Height Cm | 182.2 |
| Standard Deviation of Height cm | 6.7 |
| Average BMI for the Offensive Players | 25.7 |
| Average BMI for the Defensive Players | 26.8 |
| Average Waist Circumference for the Offensive Players cm | 60.6 |
| Average Waist Circumference for the Defensive Players cm | 88.2 |
Table 1: Showing the average and standard deviation values of age, weight and height of the participants as per the results obtained during the study. The table also indicate the average BMI and waist circumferences of the offensive and defensive players.
The Relationship between the FMS Performance and the Waist Circumference
The evaluation of the difference between the obese and non-obese waist circumferences was achieved through the analysis of the averages of these variables. The average value of the waist circumferences for the non-obese players was determined to be 84.5 with a standard deviation of 4.9 while that for the obese players was 100.4 with a standard deviation of 4.5.
Relationship between the Waist Circumferences of the Obese and Non-Obese Participants
| Non-Obese | Obese | |
| Average | 84.5 | 100.4 |
| Standard Deviation | 4.9 | 4.5 |
Table 2: The relationship between the waist circumferences of the obese and non-obese participants.
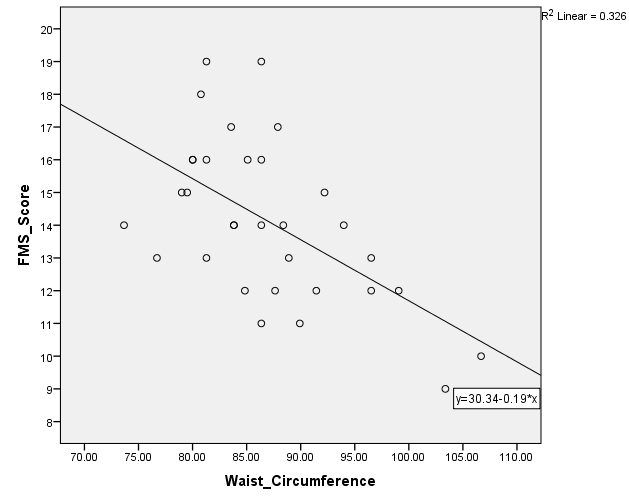
In order to determine the relationship between the FMS performance and the waist circumferences of the participants, Spearman Correlation Test used. The result from this test indicated that there was significant relationship between the FMS performance scores of the participants and their respective waist circumferences. The standard deviation of the FMS performance values was determined to be 2.5 with the average score of 14.1 while the standard deviation of waist circumferences was 7.6 with the average of 86.9 (P=0.002). This was a weak positive relationship (R2=0.326).
The Correlations between FMS Performance Scores and Waist Circumferences
Figure 1: The correlations between FMS performance scores and waist circumferences of the participants.
The Relationship between the FMS Performance and the BMI
Based on the results from this study, it was determined that the average BMI for the obese players was 33.1 with a standard deviation of 4.1 while the average for the non-obese players was 24.7 with a standard deviation of 2.8.
Relationship between the BMI of the Obese and Non-Obese Participants
| Non-Obese | Obese | |
| Average | 24.7 | 33.1 |
| Standard Deviation | 2.8 | 4.1 |
Table 3: The relationship between the BMI of the obese and non-obese participants.
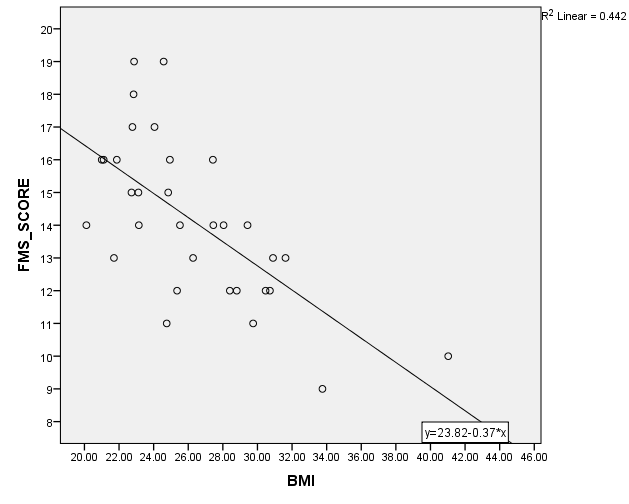
The determination of the correlations between the FMS performance scores of the participants and their BMI values was achieved through the application of the Spearman Correlation Test. The standard deviation for the BMI values was determined to be 4.5 with an average value of 26.3 (P=0.000), the correlation coefficient of the BMI was at -0.669 (R2=0.442).
The Relationship between the FMS Performance and the Injury Severity Score
The participants were grouped into groups based on their nature of the injury severity. Those who had low injury severity had an average of 25.2 with a standard deviation of 6.9 while those who had a high injury severity had an average of 50.5 with a standard deviation of 10.3. The severity of the injury was determined through the analysis of the answers provided by the participants on the four MPQ questions which was modified to produce NMQ for the establishment of numerical values of the research.
Relationship between the FMS Performance of the Obese and Non-Obese Participants
| Low Injury Severity | High Injury Severity | |
| Average | 25.2 | 50.5 |
| Standard Deviation | 6.9 | 10.3 |
Table 3: The relationship between the FMS performance scores of low injury and high injury severity participants.
The proper determination of the existing correlations between the FMS performance values of the participants and their respective injury severity score is one of the most important aspect which could be used in ensuring that the main research objectives of this study were effectively achieved. The analysis of the injury severity values obtained from the 34 participants indicated that the standard deviation was 15.3 with an average value of 36.2 (R2=0.243). At 1.000 FMS performance score, it was determined that the correlation value of the injury severity score of the participants was -0.511 (P=0.003).
Spearman Correlation
| FMS | Waist Circumference | R2 | P Value |
| 14.125 (±2.472) | 86.955 (±7.564) | 0.326 | 0.002 |
| FMS | BMI | R2 | P Value |
| 14.125 (±2.472) | 26.292 (±4.457) | 0.442 | 0.003 |
| FMS | Injury Severity Score | R2 | P Value |
| 14.125 (±2.472) | 36.234 (±15.277) | 0.243 | 0.000 |
Table 4: Spearman Correlation Table for Waist Circumference (cm), BMI and Injury Severity Score. The table shows the P value and the correlation score of the FMS scores on different variables.
Discussion
The purpose of this research study was to determine if there is any difference in FMS performances among those athletes whose injuries are above average as compared to those who do not. Additionally, it also focused on determining the effects of an obese weight and waist circumferences on the FMS performances. Coaches and talent scouts are often looking for different ways of evaluating and training their players (Kiesel et al. 2014), therefore it is important to come up with mechanisms that will enable them to effectively perform these duties (Butler et al. 2013). The height and weight of the participants were majorly applied in the calculation of their respective Body Mass Indices (BMI). The results from this study indicated that the ability of the participants to perform different FMS performance was significantly related to their BMI as well as waist circumferences in FMS performance. This study was also able to determine that those players who have obese waist circumferences are more likely to suffer from different types of body injuries as well as inappropriate body movement as compared to those who are none-obese in FMS performance. These results are in agreement with the research study conducted by Letafatkar et al. (2014) and Chapman, Laymon and Arnold (2014) which was able to establish that individuals who are obese would more likely suffer from different types of injuries based on the fact that their body structures are not often moving easily to perform different skills. Lockie et al. (2015) determined in their study that non-overweight males and females were three times more likely to possess more advanced locomotors skills than the overweight counterparts.
It was established by the results from this study that the number of non-obese participants was higher (26) than that of the obese participants (6). This observation can be linked to the fact that it is often not easy to find sportspersons who are obsess due to the intensified level of training that they undergo (Lloyd et al. 2015). Based on the fact that the university had strict guidelines concerning the participation of the players with musculoskeletal injuries, it was very difficult to find the eligible players within the seven days hence forcing the study to be conducted during the MID season. There was a significant correlation between the FMS performance scores of the participants and their respective waist circumferences. Through the application of the Spearman Correlation with a 2-tailed test, a significant value of 0.002 was obtained. The research study conducted by Garrison et al. (2015) and Warren et al. (2015) were of the opinion that the significance in the correlations between these two variables is important since it helps in easily determining the individuals who would have higher FMS scores.
Based on the research study conducted by Smith et al. (2013), it was established that FMS performance has a good inter-rater and intra-rater reliability indicating that all of the movements among the football players had good reliability on the FMS scores of the individuals. Despite the fact that the study was able to establish a positive statistically significant correlation value of 0.003 between the FMS scores and the injury severity among the participants, it important to note that the level of significance was very small in FMS performance. Nevertheless, the same results were also obtained in the research study conducted by Mokha et al. (2016) which obtained a positive correlation value of 0.31. Based on the fact that there was a narrow age range that was used in this study, this significantly led to the establishment of lack of correlation between the age of the participants and the FMS scores. The data from this research has also indicated that there were higher cases of injury in the lower body segment than in the upper segment. Such observations were explained by Franz et al. (2018) to be caused by different factors such as the occurrence of muscular imbalances, inadequate muscular strength on the lower segment, and different in the movement patterns.
There are different factors whose effects can lead to the development of a positive correlation between the BMI and the FMS performances. These factors include younger age, higher average of the FMS performance scores as well as lower BMI values of the participants Mitchell et al. (2015). Based on the results obtained from this research study, it was established that there was a significantly positive correlation between the BMI scores and the FMS performances of the participants. These results are in agreement with the research study conducted by Kraus et al. (2014) and Gribble et al. (2013) which were able to establish that the positive relationship between the BMI values and the FMS performance scores of footballers is often caused by lower values of the BMI as well as higher average FMS scores of the participants. The main finding that was obtained from the research study conducted by Chimera et al. (2015) was that the variation in the measures of the physical performances among the young footballers could be explained by the combination of different types of tests obtained from the functional movement screen protocol as well as the maturation of the somatic substances of the participants. According to Li et al. (2015), maturation of the participants was linked to the establishment of greater variations in the squat jump performances which could simply reflect the hormonal changes as well as the consequent adaptations within the muscle size and function that in influenced by the maturity.
The results from this study was able to add to the existing literature by suggesting that the functional movements are related to the weight status of the individuals with the functional movements being poorer among the obese participants. In this respect, the results from this present study are able to confirm the prior works by Bodden et al. (2015) and Dorrel et al. (2015) which were able to determine that the total FMS performance scores were significantly and inversely related to the BMI in a group containing participants who are in their late teenage and early twenties. This study was able to establish that there was a negative correlation between the FMS scores and the BMI, with a value of -0.669 being obtained. Furthermore, this study was in agreement with the research study conducted by Sprague et al. (2014) which was of the opinion that the excess weight among the adult football players can easily lead to the development of different functional limitations. Additionally, Fox et al. (2014) determined in their study that the existing functional limitations due to overweight and obesity among the football players can make them to become less physically active, gaining the fat masses in the body structures and become unable to develop the necessary Fundamental Movement Patterns which would affect their performances as compared to the football players who are lacking the functional limitations.
The linemen and football players who have high values of BMI are often at high risk of suffering from cardiovascular diseases. Miller et al. (2008) explained that the linemen were more likely to suffering from metabolic syndrome, reduced high-density lipoproteins as well as raised levels of fasting glucose leading to the increased chances of the occurrence of the cardiovascular infections. Based on the data presented in the Figure 2, it is important to take into consideration that the FMS performance score is inversely proportional to the BMI of the individuals. According to the information from the research study conducted by Perry and Koehle (2013), it was established that overweight and obesity could lead to the alterations in the musculoskeletal systems hence making the individuals who fall in this category to become more likely of suffering from different injuries associated with the musculoskeletal pain in FMS performance. There are some positions in the football field which would require big and sturdy individuals who can easily make the tackles in FMS performance. These are the defensive midfielders, defenders as well as the offensive strikers. Eveleth (2013) stated that these players would need to be big and sturdy in order to extend their arms out straight to block or resist a block which are predominantly above their waists. Due to the increased tension around the goalmouth, Lisman et al. (2013) stated that those players who are in the offensive positions such as OT, OG, C among others are often prone to injury. Nevertheless, the mean FMS score for the uninjured was determined to be 25.2 while that for the injured was 50.5 hence indicating that there were many players who were often injured at the end of a season than those who are not injured. Despite the fact that all of the players in the filed might be exposed to severe injury, Bardenett et al. (2015) in their study determined that the more a player is placed in a position that involves a lot of attacking and defending, the more they would be likely to suffer from different types of injuries.
Despite the fact that there are different mechanisms which have been proposed impacts of overweight and obesity on the functional movements, different suggestions have intended to be linked to the results from the studies among the adult populations with few studies being able to examine this trend among the children and adolescents (Cook et al. 2014). Those football players who are having obese waist circumferences are often linked to more serious types of injuries on and off the pitch as compared to those who are considered to be non-obese (Teyhen 2014). The descriptive statistics were efficiently established for all of the participants as well as their respective anthropometric, and the FMS performance scores. The efficient analysis of the FMS scores as a tool for the diagnostic test using in the prediction of the rates of injuries, specificity and sensitivity was achieved through the application of the Spearman Correlation test and the two ways ANOVA test. The results which were obtained from this research study indicated that eighteen of the participants had low scores on the injury rates while fourteen of them exhibited high scores on injury severity cases in FMS performance. These results can be effectively linked to the findings from the research study conducted by Lisman et al. (2013) and Bardenett et al. (2015) which appropriately established that there are often less cases of injury scores among the football players who are constantly involved in extensive training and adequate body functionalities. Kazman et al. (2014) in their study stated that it is often important to appropriately identify modifiable variables which are linked to the performances of the athletes’ performances as well as their respective risks for the injuries for proper management their performances and prevention of the injury risks.
The results from this study further established that those football players who had a composite FMS performance scores of 14 and below in combination with the self-reported injury history were more likely to suffer from new cases of injuries as compared to the footballers who had higher scores on the FMS performance. Despite of these results being in agreement with those which were obtained from the research study conducted by Bushman et al. (2016) and Zalai, Panics et al. (2014), it is important to note that they are more generalisable to a larger sector of the footballing population. Gribble et al. (2016) in their study stated that through the broadening of the definition of injury, the injuries which are able to limit the playing time of the players as well as those which require the attention of the medical staff are often captured. To add more information on this, the research study conducted by Wright et al. (2015) established that the broad injury definition can allow the capture of the injuries which affect the movement patterns as well as the peak performances of the players but do not lead to the establishment of significant loss of playing time of the sportspersons in FMS performance. The ability of the participants to easily train can lead to reduced cases of injury. Based on the fact that the findings from this research study was able to establish that the individual variations in the change scores had greater effects on the injury susceptibility, therefore it can be said that effective training programs can be beneficial in the cases of some of the participants as indicated by the illustrations from the research study conducted by Parenteau-G et al. (2014).
The mean FMS performance composite scores of the participants being presented in this research study was determined to be 21. These results were determined to be in agreement with the findings from the research study conducted by Frost et al. (2015) on the volleyball players, Dossa et al. (2014) on the soccer athletes and Bonazza et al. (2017) on the basketball players. The relationship between the results from these different studies can be linked to the fact that all of the athletes from these categories are often expected to apply mush stability and power as opposed to the track runners who mainly require the cardiorespiratory endurance (Engquist et al. 2015). As a mechanism of reducing the occurrence of injuries among the football players, Shojaedin et al. (2014) in their study suggested that the shoulder mobility (SM) would be required to minimise the burden of arm swinging during the running process. Proper management of the training sessions can also help in reducing the cases of new injury development among the footballers.
Conclusion
This research study was able to effectively establish the difference in the FMS performance among those athletes who have above average injury scores as compared to those who are not. The difference in the levels of FMS performance is majorly caused by the BMI and the waist circumferences of the individuals in FMS performance. Those individuals who have higher BMI values will be considered to be obese and hence they would have obese waist circumferences which make them more susceptible to injuries as compared to those who are non-obese. Therefore, this study was able to add to the growing body of evidence which demonstrates a predictable relationship between the FMS performance composite scores and the eventual development of injury among the football players. The occurrence of previous injury history provide higher chances of future injury risks in FMS performance.
Limitations and Suggestions for Future Work
There were different types of limitations for this study. One of the most important limitations was the fact that there was no thorough control of the athletic exposure since the study was dependent on whether they remembered the individual cases of injury and severity. Based on the provisions of the University ethics, the currently injured player (7 day prior) were prevented from taking part in the study hence making the number of the eligible players to be very few. There was not accuracy during the determination of the BMI values of the players due to resistance during training hence electrical body scanning could be more recommendable. The FMS performance can be used in the prediction of the right playing position of any football player due to its ability of evaluating the station of the FMS which is relevant to the performance which is specific to certain positions among the American football athletes. In order to produce more accurate, reliable and valid results, it would have been important to carry out a retrospective or longitudinal study with at least 100 participants. Based on the fact that the data collection period was limited to 4 weeks, therefore, it was difficult to obtain true representations.
Please Note: This an example of results chapter written by our experts. For similar dissertation tasks based on your instructions, please place your order here.
References
Bardenett, S.M., Micca, J.J., Denoyelles, J.T., Miller, S.D., Jenk, D.T. And Brooks, G.S., 2015. Functional Movement Screen Normative Values And Validity In High School Athletes: Can The FMS™ Be Used As A Predictor Of Injury? International Journal of Sports Physical Therapy, 10(3), pp.303-314.
Bodden, J.G., Needham, R.A. and Chockalingam, N., 2015. The Effect of an Intervention Program on Functional Movement Screen Test Scores in Mixed Martial Arts Athletes in FMS performance. The Journal of Strength & Conditioning Research, 29(1), pp.219-225.
Bonazza, N.A., Smuin, D., Onks, C.A., Silvis, M.L. And Dhawan, A., 2017. Reliability, Validity, and Injury Predictive Value of the Functional Movement Screen: A Systematic Review and Meta-Analysis. The American Journal of Sports Medicine, 45(3), pp.725-732.
Bushman, T.T., Grier, T.L., Canham-Chervak, M., Anderson, M.K., North, W.J. And Jones, B.H., 2016. The Functional Movement Screen and Injury Risk: Association and Predictive Value in Active Men in FMS performance. The American Journal of Sports Medicine, 44(2), pp.297-304.
Butler, R.J., Lehr, M.E., Fink, M.L., Kiesel, K.B. And Plisky, P.J., 2013. Dynamic Balance Performance and Noncontact Lower Extremity Injury In College Football Players: An Initial Study. Sports Health, 5(5), pp.417-422.
Chapman, R.F., Laymon, A.S. And Arnold, T., 2014. Functional Movement Scores and Longitudinal Performance Outcomes in Elite Track And Field Athletes. International Journal of Sports Physiology and Performance, 9(2), pp.203-211.
Chimera, N.J., Smith, C.A. And Warren, M., 2015. Injury History, Sex, and Performance on the Functional Movement Screen and Y Balance Test. Journal of Athletic Training, 50(5), pp.475-485.
Cook, G., Burton, L., Hoogenboom, B.J. and Voight, M., 2014. Functional Movement Screening: The Use of Fundamental Movements as an Assessment of Function‐Part 2. International Journal of Sports Physical Therapy, 9(4), pp.549.558.
Dorrel, B.S., Long, T., Shaffer, S. And Myer, G.D., 2015. Evaluation of the Functional Movement Screen as an Injury Prediction Tool among Active Adult Populations: A Systematic Review and Meta-Analysis. Sports Health, 7(6), pp.532-537.
Dossa, K., Cashman, G., Howitt, S., West, B. And Murray, N., 2014. Can Injury In Major Junior Hockey Players Be Predicted By A Pre-Season Functional Movement Screen–A Prospective Cohort Study? The Journal of the Canadian Chiropractic Association, 58(4), pp.421-438.
Engquist, K.D., Smith, C.A., Chimera, N.J. And Warren, M., 2015. Performance Comparison Of Student-Athletes And General College Students On The Functional Movement Screen And The Y Balance Test. The Journal of Strength & Conditioning Research, 29(8), pp.2296-2303.
Eveleth, R., 2013. Obesity Could Be the True Killer for Football Players. Smithsonian.com.
Fox, D., O’Malley, E. And Blake, C., 2014. Normative Data for the Functional Movement Screen™ In Male Gaelic Field Sports. Physical Therapy in Sport, 15(3), pp.194-199.
Franz, C.K., Dalamagkas, K., Jordan, L.A. And Spill, G.R., 2018. Soft Tissue Sarcoma Affecting the Right Shoulder of a Man with Paraplegia from a Remote Traumatic Spinal Cord Injury: A Case Report. Spinal Cord Series and Cases, 4(1), pp.55-64.
Frost, D.M., Beach, T.A., Callaghan, J.P. And Mcgill, S.M., 2015. FMS Scores Change With Performers’ Knowledge Of The Grading Criteria—Are General Whole-Body Movement Screens Capturing “Dysfunction”? The Journal of Strength & Conditioning Research, 29(11), pp.3037-3044.
Garrison, M., Westrick, R., Johnson, M.R. And Benenson, J., 2015. Association between the Functional Movement Screen and Injury Development in College Athletes in FMS performance. International Journal of Sports Physical Therapy, 10(1), pp.21-32.
Gribble, P.A., Brigle, J., Pietrosimone, B.G., Pfile, K.R. And Webster, K.A., 2013. Intrarater Reliability of the Functional Movement Screen. The Journal of Strength & Conditioning Research, 27(4), pp.978-981.
Gribble, P.A., Terada, M., Beard, M.Q., Kosik, K.B., Lepley, A.S., Mccann, R.S., Pietrosimone, B.G. And Thomas, A.C., 2016. Prediction of Lateral Ankle Sprains in Football Players Based On Clinical Tests and Body Mass Index. The American Journal of Sports Medicine, 44(2), pp.460-467.
Kazman, J.B., Galecki, J.M., Lisman, P., Deuster, P.A. And O’Connor, F.G., 2014. Factor Structure of the Functional Movement Screen in Marine Officer Candidates. The Journal of Strength & Conditioning Research, 28(3), pp.672-678.
Kiesel, K.B., Butler, R.J. And Plisky, P.J., 2014. Prediction of Injury by Limited and Asymmetrical Fundamental Movement Patterns in American Football Players. Journal of Sport Rehabilitation, 23(2), pp.88-94.
Kraus, K., Schütz, E., Taylor, W.R. And Doyscher, R., 2014. Efficacy of the Functional Movement Screen: A Review. The Journal of Strength & Conditioning Research, 28(12), pp.3571-3584.
Letafatkar, A., Hadadnezhad, M., Shojaedin, S. And Mohamadi, E., 2014. Relationship between Functional Movement Screening Score and History of Injury. International Journal of Sports Physical Therapy, 9(1), pp.21-27.
Li, Y., Wang, X., Chen, X. And Dai, B., 2015. Exploratory Factor Analysis of the Functional Movement Screen in Elite Athletes. Journal of Sports Sciences, 33(11), pp.1166-1172.
Lisman, P., O’Connor, F.G., Deuster, P.A. And Knapik, J.J., 2013. Functional Movement Screen And Aerobic Fitness Predict Injuries In Military Training. Medicine & Science in Sports & Exercise, 45(4), pp.636-643.
Lloyd, R.S., Oliver, J.L., Radnor, J.M., Rhodes, B.C., Faigenbaum, A.D. And Myer, G.D., 2015. Relationships between Functional Movement Screen Scores, Maturation and Physical Performance in Young Soccer Players. Journal of Sports Sciences, 33(1), pp.11-19.
Lockie, R.G., Schultz, A.B., Jordan, C.A., Callaghan, S.J., Jeffriess, M.D. And Luczo, T.M., 2015. Can Selected Functional Movement Screen Assessments Be Used To Identify Movement Deficiencies That Could Affect Multidirectional Speed And Jump Performance? The Journal of Strength & Conditioning Research, 29(1), pp.195-205.
Miller, M.A., Croft, L.B., Belanger, A.R., Romero-Corral, A., Somers, V.K., Roberts, A.J. And Goldman, M.E., 2008. Prevalence of Metabolic Syndrome in Retired National Football League Players. The American Journal of Cardiology, 101(9), Pp.1281-1284.
Mitchell, U.H., Johnson, A.W. And Adamson, B., 2015. Relationship between Functional Movement Screen Scores, Core Strength, Posture, and Body Mass Index in School Children in Moldova. The Journal of Strength & Conditioning Research, 29(5), pp.1172-1179.
Mokha, M., Sprague, P.A. And Gatens, D.R., 2016. Predicting Musculoskeletal Injury in National Collegiate Athletic Association Division II Athletes from Asymmetries and Individual-Test versus Composite Functional Movement Screen Scores in FMS performance. Journal of Athletic Training, 51(4), pp.276-282.
Parenteau-G, E., Gaudreault, N., Chambers, S., Boisvert, C., Grenier, A., Gagné, G. And Balg, F., 2014. Functional Movement Screen Test: A Reliable Screening Test for Young Elite Ice Hockey Players. Physical Therapy in Sport, 15(3), pp.169-175.
Perry, F.T. And Koehle, M.S., 2013. Normative Data for the Functional Movement Screen in Middle-Aged Adults. The Journal of Strength & Conditioning Research, 27(2), pp.458-462.
Shojaedin, S.S., Letafatkar, A., Hadadnezhad, M. And Dehkhoda, M.R., 2014. Relationship between Functional Movement Screening Score and History of Injury and Identifying the Predictive Value of the FMS performance for Injury. International Journal of Injury Control and Safety Promotion, 21(4), pp.355-360.
Smith, C.A., Chimera, N.J., Wright, N.J. And Warren, M., 2013. Interrater and Intrarater Reliability of the Functional Movement Screen. The Journal of Strength & Conditioning Research, 27(4), pp.982-987.
Sprague, P.A., Mokha, G.M. And Gatens, D.R., 2014. Changes in Functional Movement Screen Scores over a Season in Collegiate Soccer and Volleyball Athletes and FMS performance. The Journal of Strength & Conditioning Research, 28(11), pp.3155-3163.
Teyhen, D., Bergeron, M.F., Deuster, P., Baumgartner, N., Beutler, A.I., Sarah, J., Jones, B.H., Lisman, P., Padua, D.A., Pendergrass, T.L. And Pyne, S.W., 2014. Consortium for Health and Military Performance and American College of Sports Medicine Summit: Utility of Functional Movement Assessment in Identifying Musculoskeletal Injury Risk. Current Sports Medicine Reports, 13(1), pp.52-63.
Warren, M., Smith, C.A. And Chimera, N.J., 2015. Association Of The Functional Movement Screen With Injuries In Division I Athletes in FMS performance. Journal of Sport Rehabilitation, 24(2), pp.163-170.
Wright, M.D., Portas, M.D., Evans, V.J. And Weston, M., 2015. The Effectiveness of 4 Weeks of Fundamental Movement Training on Functional Movement Screen and Physiological Performance in Physically Active Children in FMS performance. The Journal of Strength & Conditioning Research, 29(1), pp.254-261.
Zalai, D., Panics, G., Bobak, P., Csáki, I. And Hamar, P., 2014. Quality of Functional Movement Patterns and Injury Examination in Elite-Level Male Professional Football Players. Acta Physiologica Hungarica, 102(1), pp.34-42.