What is a Gantt Chart and Why Use It?
- Gantt Chart Definition: A Gantt chart is a visual project management tool used to represent the timeline of a project. It displays tasks, their start and end dates, and milestones in a horizontal bar format.
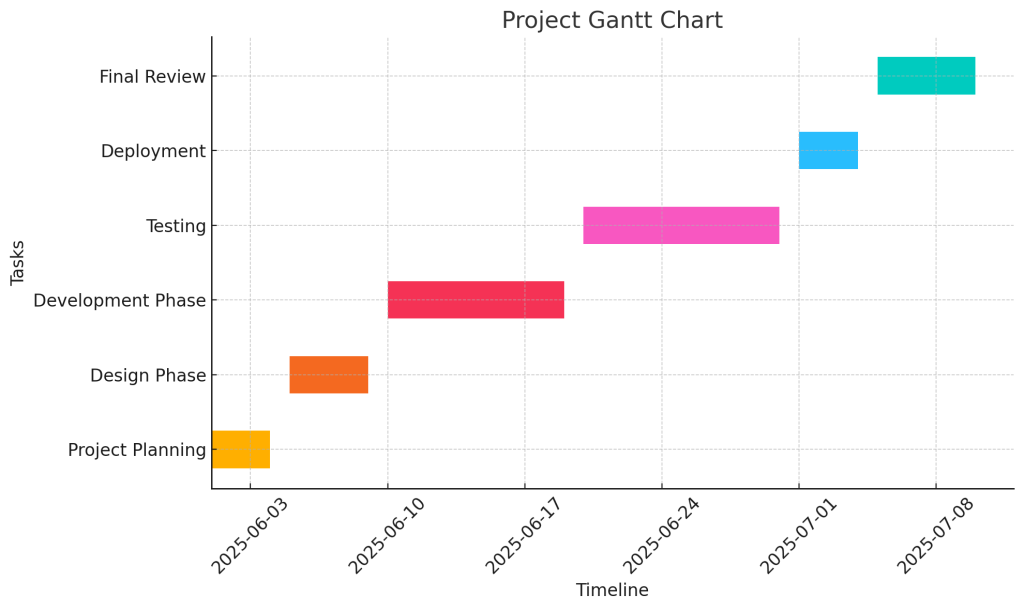
- Project Schedule Visualization: The Gantt chart’s horizontal bars represent the time span of each task, helping teams to visualize the overall project schedule. It allows project managers to easily see when tasks need to be completed and how they align with other tasks.
- Task Dependencies: A key feature of the Gantt chart is its ability to show dependencies between tasks. Dependent tasks are those that cannot start until another task is finished, and this relationship is visually represented through arrows linking the tasks.
- Modern Gantt Chart: The modern Gantt chart has evolved from Henry Gantt’s original design to include features like task dependencies, progress tracking, and resource management, making it more efficient for managing complex projects.
- Project Manager’s Tool: The Gantt chart is an essential tool for a project manager, as it provides a clear overview of the project’s progress and ensures that all team members understand their roles and deadlines.
- Work Breakdown Structure: The Gantt chart is often used alongside the work breakdown structure (WBS), where tasks are broken down into smaller, manageable parts. This method helps ensure that all deliverables are achieved according to the timeline.
- Used Across Industries: From software development to construction projects, the Gantt chart is a versatile project management tool used across various sectors, helping teams keep their projects on track.
Expert Dissertation Proposal Assistance
Get professional help with your dissertation proposal and Gantt chart from experienced writers. Ensure your project is on track with clear milestones and timelines. Let us guide you to academic success!
Understanding the Components of a Gantt Chart
- Tasks: Each task in a Gantt chart is represented by a bar, with the start and end date of the task clearly marked. Tasks may be categorized based on phases or deliverables.
- Milestones: Milestones are key events or goals within the project that are marked on the Gantt chart. They indicate significant progress points, ensuring that the project stays on track.
- Dependencies Between Tasks: Dependent tasks are connected by arrows to show the order in which tasks must be completed. These dependencies ensure that tasks are performed in a logical sequence, reducing the risk of delays.
- Resource Management: Modern Gantt charts, particularly those created with project management software like Microsoft Project, can integrate resource management features. This allows project managers to assign tasks to specific team members and monitor workload distribution.
- Project Management Software Integration: Gantt charts can be created using various management software like Excel Gantt charts or advanced project management tools, which enhance collaboration, track progress, and help in resource management.
How Gantt Charts Improve Project Management
- Task Tracking and Visibility: By visually tracking the progress of tasks, Gantt charts help project managers monitor the project’s timeline. This ensures that every task, from software development to construction projects, is on schedule.
- Milestone Tracking: Gantt charts make it easier to track milestones and ensure that deliverables are achieved. This is particularly important in large projects where multiple teams are involved.
- Improved Communication: Gantt charts serve as a shared visual reference for the entire team, improving communication. Everyone involved in the project can see the overall timeline, task deadlines, and progress at a glance.
- Ensuring Project on Track: By identifying any delays in the project schedule, Gantt charts allow managers to make adjustments and keep the project on track. This is critical for meeting deadlines and delivering high-quality results.
Why You Should Use Gantt Charts for Your Projects
- Efficient Project Planning: A Gantt chart allows for detailed planning by breaking the project into tasks with start and end dates, milestones, and dependencies. This makes it easy to understand how each part of the project contributes to the overall goal.
- Organizing Complex Projects: For complex projects with multiple deliverables, such as construction projects or software development initiatives, the Gantt chart provides a clear overview of how all parts of the project fit together.
- Easy Adjustments: The flexibility of modern Gantt charts allows project managers to adjust tasks or timelines if needed. Changes can be made in real-time, ensuring the project schedule remains realistic.
- Resource Management: With resource management features integrated into Gantt charts, project managers can effectively assign resources to tasks and prevent overloading any individual or team. This is particularly valuable for dependent tasks, ensuring that resources are allocated efficiently.
- Supports Modern Project Management: Whether using Microsoft Project or an Excel Gantt chart, Gantt charts provide a comprehensive view of the project, making them indispensable for project managers looking to organize and optimize their projects.
How to Create a Gantt Chart Effectively?
- Start with Defining the Project Scope: Before you begin creating your Gantt chart, clearly define the project scope. This will help in identifying all the tasks, milestones, and key deliverables, ensuring you include everything necessary in the project gantt chart.
- Identify All Project Tasks: Break down the entire project into smaller, manageable tasks. The Gantt chart format works best when you have a comprehensive list of tasks to represent. Each task will be represented by Gantt bars, and they should correspond to specific goals or milestones within the project.
- Establish Dependencies Between Tasks: A crucial part of creating an effective Gantt chart is understanding the relationship between tasks. Some tasks may depend on the completion of others before they can begin. By linking tasks with arrows or lines in the chart, you can visualize dependencies between tasks and ensure the project flows logically.
- Set Start and End Dates: For each task, determine the start and end dates. These dates will be represented by the length of the Gantt bars in your Gantt chart. Ensuring that these dates are realistic is key to having a successful project.
- Incorporate Milestones: Identify important milestones in your project. These could be key deliverables or phases that mark significant achievements. Milestones are represented as special markers in the Gantt chart and help in tracking the progress of the project.
Steps to Create a Gantt Chart Template
- Choose Your Tools: The first step in creating a Gantt chart template is deciding on the platform. You can use simple tools like Microsoft Excel Gantt charts or more sophisticated project management software like Microsoft Project.
- Customize Your Chart Format: A customizable Gantt chart allows you to adapt the Gantt chart format to fit the needs of your project. You can add columns for task names, durations, deadlines, and resources. Tailor the chart layout to your specific requirements, keeping in mind that Gantt charts are versatile tools.
- Input Task Information: Create rows for each task, input their durations, and add any relevant milestones or deadlines. This will help in organizing the tasks for easy tracking throughout the project lifecycle.
- Update Your Chart Regularly: A Gantt chart is a living document that should be updated regularly to reflect changes. This is especially true if there are delays or new tasks added to the project.
Timely Dissertation Proposal Writing Support
Need a well-structured dissertation proposal? Our expert writers help create comprehensive proposals with detailed Gantt charts. Stay organized and meet deadlines with the support of the best dissertation writers in the field.
Best Practices for Making a Gantt Chart
- Be Clear and Concise: Keep your Gantt chart clear and easy to understand. Avoid cluttering the chart with too much detail, as this can make it harder for team members to track progress.
- Highlight Key Milestones: Milestones should be clearly marked so that everyone can see when important achievements are expected. This will keep the team motivated and aligned on the project’s progress.
- Use the Right Scale: Choose the time scale that works best for your project. For example, a software development project may need a visual timeline that shows tasks over weeks, while a construction project might need one that spans months.
- Review Regularly: Make sure to review the Gantt chart regularly to keep the project on track. Regular reviews help to ensure that any delays or issues are addressed promptly.
- Ensure Collaboration: Gantt charts also serve as a communication tool for teams. By collaborating and updating the Gantt chart, everyone involved will have a clear understanding of the current status and upcoming tasks.
Utilizing Gantt Chart Software for Your Project Plan
- Leverage the Power of Gantt Charts: Modern Gantt charts are incredibly powerful tools for managing complex projects. Using project management software like Microsoft Project or Excel Gantt charts helps streamline the planning and execution of tasks, making it easier to manage the entire project from start to finish.
- Easy Task Allocation: Gantt charts make it easy to allocate tasks to team members, track progress, and adjust timelines as needed. This is particularly helpful in project management, as it keeps everyone accountable and ensures no tasks are overlooked.
- Track Dependencies: Gantt charts are especially useful when managing dependent tasks. They allow you to easily track which tasks cannot begin until others are completed, ensuring your project flows smoothly.
- Review and Adjust the Timeline: With Gantt charts in project management software, you can adjust the project timeline in real time. This feature ensures that any delays or changes in priorities are quickly reflected, keeping the project on track.
- Versatile Tool for Any Project: Whether you are managing a software development project or a construction project, Gantt charts are incredibly versatile and can be adapted to suit any type of project. Their visual nature makes them ideal for showing progress and dependencies, ensuring everyone involved has a clear understanding of the project’s trajectory.
By following these best practices and utilizing the power of Gantt charts, you can ensure a more organized and efficient approach to your project planning and execution.
What are the Benefits of Using Gantt Chart Software?
- Improved Project Tracking: Gantt chart software enables project managers to schedule and track the progress of project and its tasks in real time. This provides a clear, visual overview of project timelines, helping teams stay on track and meet deadlines.
- Task Dependencies and Relationships: One of the key benefits of Gantt charts is their ability to illustrate dependencies between tasks. This allows teams to understand the relationship between tasks and ensure that work progresses logically, without confusion or delays.
- Enhanced Collaboration: Gantt chart software facilitates collaboration among team members by offering a central place to view tasks, milestones, and timelines. It helps ensure everyone is on the same page, which is critical in project management.
- Better Resource Management: With Gantt charts, you can easily manage resources. By tracking who is working on what and when, Gantt charts give project managers the ability to allocate resources more efficiently, avoiding overburdening any one individual or team.
- Real-Time Updates: Gantt chart software allows for quick, real-time updates to task schedules and timelines. This ensures that any changes made during the course of the project are reflected instantly, helping to keep the project on track.
Advantages of Online Gantt Chart Software
- Accessibility: One of the main advantages of online Gantt chart software is its accessibility. Team members can access the Gantt chart from anywhere, making it easy for remote teams to collaborate and stay updated on the project’s status.
- Ease of Use: Online Gantt charts are typically user-friendly and easy to navigate. They allow you to make Gantt charts quickly and with minimal effort, even for those with little technical expertise.
- Real-Time Collaboration: With online Gantt charts, multiple team members can work on the same chart simultaneously, making collaboration easier and more efficient. This is particularly helpful for large, distributed teams working on complex projects.
- Scalability: Online Gantt chart software can handle projects of varying sizes, from small teams to large organizations, making it a scalable solution for any project management need.
- Integration with Other Tools: Online Gantt chart software often integrates with other project management tools, such as communication platforms or task management systems, to streamline project execution.
Comparison of Gantt Chart Software Tools
- Microsoft Project: One of the most well-known Gantt chart tools, Microsoft Project offers robust features for large-scale project management. It includes tools for scheduling, tracking dependencies, and resource management. It is ideal for more complex projects but can have a steeper learning curve.
- Trello with Gantt Chart Plugin: For teams using Trello for task management, adding a Gantt chart plugin can offer a great way to visualize project timelines. It provides a simple way to track project and its tasks, and is often used in agile project management.
- Asana: Asana offers a Gantt chart version of the chart called Timeline, allowing project managers to map tasks to a timeline, track dependencies, and manage resources. It is known for its intuitive interface and flexibility.
- Smartsheet: Smartsheet combines traditional Gantt charts with project management capabilities, offering collaboration features, file sharing, and integration with other tools. It is a great option for teams looking for a cloud-based Gantt chart tool.
- Wrike: Wrike offers Gantt charts to plan and track projects while providing tools for real-time collaboration and communication. It integrates well with other project management software, making it a popular choice for large teams.
Free Gantt Chart Options Available
- Excel Gantt Chart: A simple way to create a project schedule without investing in expensive software. While not as feature-rich, Excel Gantt charts are highly customizable and offer basic tracking features for smaller projects.
- TeamGantt: TeamGantt offers a free version of their software for smaller teams. It provides basic features such as task management, scheduling, and progress tracking, making it an excellent choice for small projects or teams just getting started with Gantt charts.
- ClickUp: ClickUp offers a free version that includes Gantt chart features for managing and tracking tasks. It’s a great option for teams that need simple project management tools without the cost.
- Trello with Gantt Chart Power-Up: Trello’s free version includes the ability to add Gantt chart features using a Power-Up. This is a great option for teams already using Trello for task management and looking for a simple visual timeline.
- GanttProject: GanttProject is an open-source tool for making Gantt charts. It provides features like task management, milestone tracking, and dependencies, making it a solid free option for smaller projects or personal use.
The benefits of Gantt charts are numerous, especially when using the right Gantt chart software. Whether you are managing a small team or a large-scale project, there are various tools available to help you stay organized, track progress, and ultimately complete the project efficiently.
How to Use a Gantt Chart in Project Management?
- Assigning Tasks and Setting Deadlines: One of the primary ways a Gantt chart is used in project management is by assigning tasks and setting deadlines. By clearly outlining each task, its start date, and its duration, the Gantt chart provides a visual representation of the entire project timeline. This is essential for staying on schedule and ensuring that no tasks are overlooked.
- Task Assignment: You can assign specific tasks to team members and track their progress on the Gantt chart.
- Deadlines: Setting clear deadlines for each task on the Gantt chart helps ensure that the project is completed on time.
- Managing Task Dependencies with Gantt Charts: A Gantt chart is an excellent tool for managing task dependencies, which are tasks that cannot begin until others are finished. This is vital in project management as it helps to organize the workflow and ensures that each task is completed in the proper order.
- Task Relationships: By using a Gantt chart to map the dependencies between tasks, you can easily see which tasks must be completed before others can begin. This helps in avoiding project delays.
- Visualizing Dependencies: Arrows or lines are typically drawn on the Gantt chart to connect tasks and show their dependencies. This visual representation makes it easy to identify bottlenecks or areas where tasks may need to be rescheduled.
- Visualizing Your Project Timeline with a Gantt Chart: A Gantt chart allows you to visualize your project timeline by showing a series of tasks along a visual timeline. This enables you to see the entire project at a glance, including the start and end dates of each task.
- Project Overview: With a Gantt chart, you can easily get an overview of your project and track the overall progress.
- Tracking Project Progress: A key advantage of using a Gantt chart is its ability to track the project’s progress in real time. As tasks are completed, you can update the chart, helping to ensure that everything stays on track.
Assigning Tasks and Setting Deadlines
- Using a Gantt Chart Maker: A Gantt chart maker can help you create a detailed, well-organized chart. The tool allows you to input tasks, set deadlines, and assign resources. This makes it easier to manage tasks and ensure that everyone knows what is expected of them.
- Set Realistic Deadlines: When customizing your Gantt chart, it’s important to set realistic deadlines for each task. This will help prevent delays and allow for proper resource allocation.
Managing Task Dependencies with Gantt Charts
- Mapping Dependencies: A Gantt chart allows you to map dependencies between tasks by visually linking them with arrows or lines. This shows you which tasks cannot be started until another task is completed. For example, in construction, you can’t start building the next floor until the current one is finished.
- Minimize Delays: By managing task dependencies effectively, you can reduce the risk of delays, ensure a smooth workflow, and avoid overloading resources at critical points of the project.
Gantt Chart and Proposal Writing Experts
Achieve your academic goals with a well-crafted dissertation proposal and project Gantt chart. Our team of expert dissertation writers will help you create a clear, actionable plan for success. Get started today!
Visualizing Your Project Timeline with a Gantt Chart
- Timeline Overview: A Gantt chart provides a clear visual timeline of your project, allowing stakeholders to understand the project’s progress and deadlines. Whether you are managing a small project or a large-scale initiative, the Gantt chart offers a concise, easy-to-read overview.
- Communication with Stakeholders: When you share your Gantt chart with stakeholders, they can instantly see the status of the project and track its progress. This transparency improves communication and fosters trust among the team and stakeholders.
- Best Project Management Practices: To track the project effectively, it’s crucial to update the Gantt chart regularly. This helps ensure that tasks are being completed on time and that any changes or delays are promptly addressed.
The Gantt chart, first introduced by Henry Gantt, has evolved into an essential tool for project management. By using a Gantt chart to assign tasks, set deadlines, manage dependencies, and visualize your project timeline, you can ensure smoother workflows, better communication, and ultimately, a successful project completion.