How is Forecasting Done in Power BI? – Key Takeaways
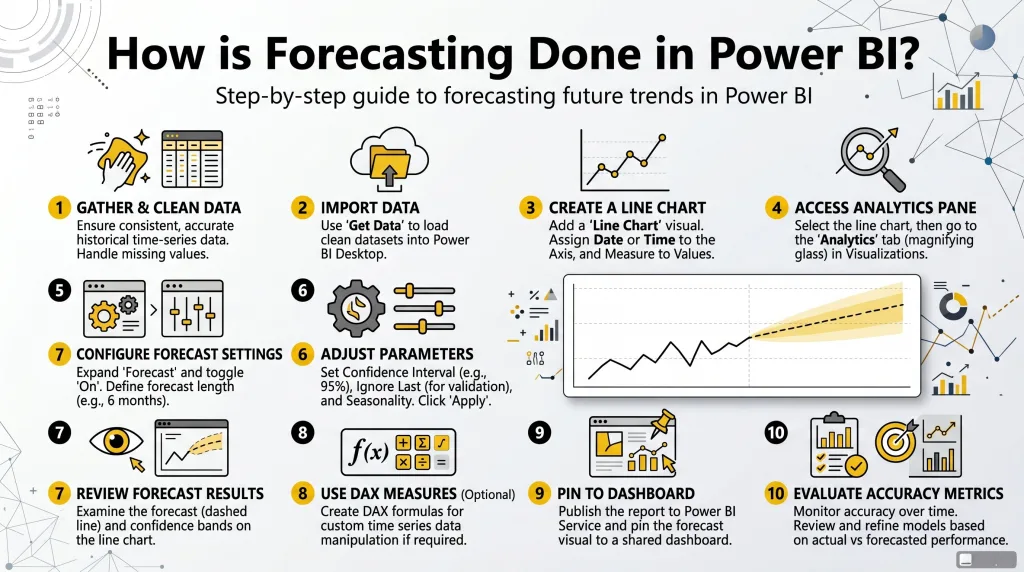
- Step 1: Prepare and Clean Your Data
- Ensure your data is time-based, such as daily, weekly, or monthly entries. Clean the data using Power Query to remove any duplicates, missing values, and ensure date fields are properly formatted.
- Consistency in time intervals is key for accurate forecasting, so ensure that data points are evenly spaced.
- Step 2: Load Data into Power BI
- Import your dataset from various sources like Excel, SQL Server, or Web APIs. Use Power Query to load data into Power BI and ensure that the date column is set as a proper date field.
- Create a model ensuring that the time dimension is properly connected to the data points for accurate analysis.
- Step 3: Select the Right Visualization
- Use a Line Chart to visualize the forecast. This is the most common and effective visual for forecasting as it shows the trend over time.
- Drag your date column to the Axis section and the measure (e.g., sales or revenue) to the Values section in the visual pane.
- Step 4: Enable and Configure Forecasting
- With the Line Chart selected, go to the Analytics pane and click on the “Add” button under Forecast.
- Set the forecast length (e.g., 12 months), which tells Power BI to extend the forecast line beyond your data points.
- Adjust the Confidence Interval (e.g., 95%) to control how certain you are about your forecasted range.
- Step 5: Fine-Tune Forecast Settings
- Use the Seasonality option to account for recurring trends, such as holiday sales. Power BI can automatically detect this or allow you to manually adjust it.
- To improve accuracy, experiment with different confidence levels and forecast lengths based on your data.
- Step 6: Add the Forecast to Your Dashboard
- Once the forecast is configured, you can pin it to your Power BI dashboard for easier monitoring alongside actual data.
- Refresh your data regularly to update the forecast with the latest insights and trends.
- Step 7: Evaluate and Refine Forecasting Accuracy
- Compare forecasted values against actual outcomes to measure accuracy using metrics like Mean Absolute Error (MAE) or Root Mean Square Error (RMSE).
- If necessary, refine your model using DAX formulas or advanced techniques like linear regression, exponential smoothing, or Python/R scripts for more complex forecasting needs.
Introduction: How is Forecasting Done in Power BI?
- Power BI offers built-in forecasting capabilities that are seamlessly integrated into its platform for data analysis, enabling users to predict future trends based on historical data.
- By leveraging forecasting tools and the forecast feature in Power BI, you can unlock predictive insights that inform business decisions, such as sales forecasting, demand forecasting, and other key operational strategies.
- With Microsoft Power BI, you can easily apply forecasting directly in Power BI dashboards and reports using simple point-and-click features.
- The forecast line in Power BI’s built-in forecasting visuals helps you visualize predicted values along with historical data, allowing you to analyze trends and performance in real-time.
- Power BI’s built-in forecasting allows you to generate predictive models using past data to create forecasts for various business scenarios like budgeting, inventory management, and financial planning.
- Power BI Desktop provides the flexibility to perform forecasting directly within the application, making it an ideal platform for both beginners and advanced users who are keen to forecast future outcomes using predictive forecasting models.
- With Power BI’s forecasting, users can quickly identify data trends, estimate future values, and make informed business decisions based on forecasting results.
Understanding Forecasting Techniques in Power BI
- Forecasting in Power BI leverages predictive analytics to estimate future values based on historical data.
- One of the most common methods in Power BI is time series forecasting, which analyzes historical data points collected at regular intervals (e.g., daily, monthly) and extrapolates those patterns into the future.
- Power BI offers built-in forecasting tools, which can be easily added to line charts for a clear view of trends over time. You can forecast with confidence using these built-in forecasting capabilities. Key forecasting techniques in Power BI include:
- Exponential Smoothing (ETS): This method smooths data to identify long-term trends and seasonality in the dataset. It’s a simple yet powerful technique for creating predictive models in Power BI.
- Linear Regression: Power BI allows you to apply linear regression forecasting to predict trends using historical data. This approach helps understand how past trends can influence future values.
- Seasonal Forecasting: For datasets with strong seasonal patterns, Power BI’s forecasting feature allows you to model seasonal variations in data to make accurate predictions.
- The confidence interval in Power BI’s built-in forecasting visuals provides a range of values within which the actual data points are likely to fall, enhancing the reliability of predictions.
Time Series Forecasting in Power BI
- Time series forecasting in Power BI is a statistical method that analyzes temporal data points to predict future values.
- Power BI makes it easy to visualize these predictions with a forecast line that extends from historical data into future data points. This helps businesses visualize trends and make informed decisions. Key features of time series forecasting in Power BI:
- Power BI supports time-based data models, making it ideal for analyzing trends such as sales data, customer traffic, inventory levels, and more.
- You can adjust the forecast length in Power BI to suit your specific needs, whether you’re forecasting for days, months, or even years.
- With time series forecasting, Power BI can automatically generate a forecast line in the visual to represent predicted values over time.
- Forecasting accuracy is enhanced by Microsoft Power BI’s ability to incorporate historical data and forecast trends into future periods, while also factoring in seasonal variations and other time-based elements.
- Power BI’s built-in forecasting capabilities work with a variety of time series data, making it a valuable tool for anyone needing to make predictive forecasts over time.
Using Power BI to Build Accurate Forecast Models
- To create accurate forecast models using Power BI, you need to start by analyzing data in Power BI Desktop. This process involves selecting the right data model and choosing the appropriate forecasting option.
- Power BI makes it easy to build forecasting models by combining historical data with predictive techniques.
- By integrating forecasting within Power BI’s visuals, you can build accurate models that project future outcomes based on existing patterns and trends. Here’s how to build effective forecast models:
- Import your data: Bring your historical data into Power BI through Power Query, and ensure it is clean and well-structured.
- Select the right forecasting method: Depending on your data’s nature, choose from various forecasting techniques, such as time series forecasting or exponential smoothing.
- Adjust forecast length: Set the forecast length to match your desired time period (e.g., forecasting sales for the next month, quarter, or year).
- Analyze data points: Use line charts to plot your historical data and apply a forecast line to project future values.
- Enable forecasting: Power BI makes it easy to enable the forecast feature directly in your visuals by simply clicking the “forecast” option in your chart.
- Review the results: The forecasting tool in Power BI will automatically generate future predictions based on the selected data points.
The Role of DAX Formulas in Power BI Forecasting
- DAX formulas (Data Analysis Expressions) play a crucial role in building forecasting models in Power BI. These formulas enable you to perform complex calculations, manipulate data, and enhance forecast accuracy.
- In forecasting with Power BI, you can use DAX to create custom measures and calculated columns that help predict future data based on existing data patterns. Important DAX functions for forecasting in Power BI include:
- TIME INTELLIGENCE FUNCTIONS: These functions help calculate date-based measures, such as year-to-date (YTD) or period-over-period comparisons, which are useful for forecasting in Power BI.
- FORECASTING FORMULAS: DAX allows you to implement advanced forecasting algorithms such as exponential smoothing, moving averages, and linear regression directly inside Power BI.
- PREDICTIVE MEASURES: DAX formulas allow you to define measures for predictive insights, such as sales forecasts or future customer demand, using historical data and time series forecasting.
- DAX formulas enhance the flexibility and accuracy of forecasting models, enabling businesses to tailor forecasts based on specific criteria and forecasting needs.
Implementing Time Series Forecasting in Power BI
- Power BI supports time series forecasting, which is ideal for analyzing patterns in data that change over time, such as sales growth, customer acquisition, and operational efficiency.
- With time series forecasting in Power BI, you can predict future trends by analyzing historical data points in relation to time, including daily, monthly, or annual intervals.
Steps to implement time series forecasting in Power BI:
- Prepare your data: Start by ensuring your data is properly organized by time intervals, such as dates or months. Power BI supports time-based data, making it easy to create accurate forecasts.
- Select a chart type: Use a line chart to visualize the forecasting feature and add a forecast line to represent predicted values.
- Enable forecasting: In Power BI, click the forecasting option in the visual settings to enable forecasting on your chart. Power BI automatically analyzes the data to generate the forecast.
- Customize the forecast: Adjust the forecast length to suit your needs and ensure that Power BI’s built-in forecasting accounts for trends, seasonality, and other variables.
- Analyze the forecast: Review the forecasting results, and make adjustments based on the accuracy of the model. Power BI also provides a confidence interval, giving you a range within which future data points are likely to fall.
Struggling with Your Data Analysis or Dissertation Statistics?
Get expert assistance with your data analysis projects or dissertation statistics from Best Dissertation Writers . Our team specializes in providing dissertation statistics help , ensuring accurate, well-analyzed results tailored to your research needs. Visit our site to get professional guidance and elevate the quality of your data-driven projects.
Get Professional HelpAdvanced Forecasting Capabilities in Power BI
- Microsoft Power BI offers advanced forecasting capabilities for users who need more complex predictive models.
- With advanced data analysis in Power BI, you can combine historical data with external data sources, such as Python or R scripts, to enhance your forecasting models. Key features of advanced forecasting in Power BI:
- Collaborative Forecasting: Power BI allows teams to collaborate and share insights around the forecast line, making it ideal for strategic planning and decision-making.
- Complex Forecasting Scenarios: Power BI supports complex forecasting by integrating custom DAX formulas, and it allows forecasting with Python or R scripts to build more sophisticated models.
- Integration with Microsoft Fabric: Power BI also integrates with Microsoft Fabric, a collaborative environment that can help you manage your data flows and create predictive forecasts at scale.
- Power BI’s advanced forecasting capabilities are designed to handle large datasets and provide highly accurate predictions, making it a comprehensive platform for forecasting.
Using Power Query for Effective Data Preparation in Forecasting
- Power Query is an essential tool within Power BI that enables users to clean, transform, and load data into the Power BI data model efficiently. When forecasting in Power BI, data preparation is crucial because the quality of your data directly impacts the accuracy of your forecasts. Steps to prepare data for forecasting using Power Query:
- Load your data: Start by importing your data into Power BI. Power Query supports a variety of data sources, including databases, Excel files, and cloud-based platforms like Power BI Dataflows.
- Data cleaning: Ensure your data is free from errors, missing values, or outliers. Power Query allows you to easily filter, sort, and clean data before using it in your forecasting models.
- For example, you can remove null values, duplicate rows, or filter out irrelevant data points.
- Transform data: In Power Query, you can apply transformations like converting date formats, changing column types, and splitting data into multiple columns. This is essential to ensure the data fits the forecasting model’s requirements.
- Shape data into the desired format: Organize your data into a consistent format that makes it easier to forecast. For instance, if you’re forecasting sales, ensure that sales data is structured with consistent time series intervals (e.g., daily, weekly, monthly).
- Combine multiple data sources: Often, data for forecasting is scattered across different sources. Power Query enables you to combine different data sources into a unified dataset. This is essential when you’re working with external data such as weather patterns, market conditions, or other external variables that can influence your forecast.
- Load data into Power BI: Once the data is clean and transformed, load it into the Power BI data model. This dataset will now be ready for forecasting analysis.
- Forecasting using Power BI starts with clean, structured data. Proper use of Power Query ensures that the data fed into your forecasting models is accurate and well-organized, enhancing the reliability of your predictions.
Visualizing Forecast Data in Power BI Reports and Dashboards
- Power BI visuals provide a wide range of options to display your forecasting results. Visualizations help convey the predicted trends and actual data points in an easy-to-understand manner for stakeholders. Key visualizations for forecasting in Power BI:
- Line charts: One of the most common visuals for forecasting in Power BI is the line chart. The line chart is useful for displaying both historical data and forecast lines to predict future trends. It clearly shows the changes over time and how well the forecast aligns with actual data.
- Area charts: Area charts are similar to line charts but fill the area beneath the line, which helps highlight the magnitude of the forecasted values. This is particularly useful when visualizing trends over time and how they may impact business decisions.
- Scatter plots: Scatter plots can be used to visualize relationships between variables and identify patterns or trends that may affect your forecast. This is especially valuable when combining different forecasting techniques to predict complex scenarios.
- Forecasting visuals: Power BI offers specific forecasting visuals that integrate seamlessly with the forecast feature. These visuals include the forecast line, confidence intervals, and future predictions, all within a single visual. Power BI automatically generates these forecast visuals based on historical data, making it easier for users to visualize forecasting processes.
- Combo charts: Combo charts in Power BI allow you to combine multiple types of charts, such as bar and line charts, to visualize both actual data and forecasts in one view. This can be particularly useful when analyzing different data points alongside forecasted values.
- Slicers: Power BI slicers allow users to filter and interact with the data. By adding slicers to your reports and dashboards, you can enable users to explore different forecasting scenarios by selecting specific time periods or data categories.
- By using these visuals in Power BI, you can effectively communicate your forecasting results to decision-makers, enabling them to understand how the forecast was generated and how future trends might unfold.
Enhancing Forecast Accuracy with Power BI
- Forecasting accuracy is a critical factor in the effectiveness of any forecasting model. Power BI provides various data analysis tools and techniques that can help improve the accuracy of your predictive forecasts. Strategies to enhance forecast accuracy:
- Refining your data model: Ensure your data is correctly structured and accurately reflects the underlying trends. This involves using appropriate time series data, adjusting for seasonality, and ensuring that data points are consistently recorded at regular intervals.
- Using confidence intervals: Power BI’s confidence interval feature provides a range of values within which the actual values are likely to fall. By considering the confidence interval, you can make more informed decisions and understand the level of uncertainty in your forecast.
- Fine-tuning forecast length: Power BI allows you to adjust the forecast length, enabling you to forecast for short-term or long-term periods based on your needs. It’s important to align the forecast length with your business goals and data availability to ensure the forecast is realistic and accurate.
- Combining forecasting techniques: Power BI supports a range of forecasting methods, including exponential smoothing, linear regression, and seasonal adjustments. Combining these methods can improve forecast accuracy, especially for complex scenarios.
- Validating models: Use historical data to validate the accuracy of your forecasting models. Compare the forecasted values with actual outcomes to identify any discrepancies or areas for improvement.
- Regularly updating forecasts: Power BI makes it easy to update forecasts as new data becomes available. Regularly updating your forecasting models ensures that they stay relevant and accurate as market conditions or business operations change.
- Leveraging advanced analytics: By integrating data science techniques into Power BI, such as Python or R scripts, you can apply more sophisticated forecasting algorithms that go beyond Power BI’s native capabilities. This is especially helpful for complex forecasting scenarios where standard methods may not be sufficient.
- Forecasting usually works best when the data is continuously updated and refined. Power BI’s integration with Power BI Dataflows and the ability to leverage advanced data science methods help enhance the overall forecasting accuracy.
Planning and Forecasting with Power BI for Better Business Insights
- Planning and forecasting are integral to strategic decision-making in any business. Power BI allows businesses to use forecasting capabilities to predict future trends, plan budgets, and optimize operations. Key areas where forecasting can enhance planning:
- Sales forecasting: Power BI is widely used for sales forecasting, where businesses can predict future sales based on historical data. Accurate sales forecasts enable businesses to plan inventory, staffing, and marketing strategies effectively.
- Demand forecasting: For businesses that rely on product demand, forecasting in Power BI helps predict consumer behavior and market trends. This is particularly important for industries like retail and manufacturing, where understanding demand can impact production schedules and inventory levels.
- Financial planning: Power BI can assist in financial planning by forecasting revenue, expenses, and profits. By using predictive models, companies can assess potential financial outcomes and create more accurate budgets.
- Strategic decision-making: Businesses can leverage Power BI’s forecasting tools to make strategic decisions, such as entering new markets or launching new products. By forecasting market trends, Power BI helps businesses anticipate challenges and opportunities.
- Human resource planning: Power BI can also be used for workforce planning. By forecasting employee turnover, recruitment needs, and labor costs, companies can optimize their HR strategies.
- By combining forecasting with business intelligence, Power BI allows organizations to make data-driven decisions that improve business performance and drive growth.
Struggling with Your Data Analysis or Dissertation Statistics?
Get expert assistance with your data analysis projects or dissertation statistics from Best Dissertation Writers . Our team specializes in providing dissertation statistics help , ensuring accurate, well-analyzed results tailored to your research needs. Visit our site to get professional guidance and elevate the quality of your data-driven projects.
Get Professional HelpUsing Power BI for Business Forecasting Analysis
- Business forecasting analysis involves the use of historical data to make predictions about future business outcomes. Power BI makes it easy to analyze forecasting data through its intuitive dashboard and reporting features. Key benefits of business forecasting with Power BI:
- Real-time insights: With Power BI visuals, users can see real-time updates to forecasting models as new data flows in. This ensures that businesses are always working with the latest information to make informed decisions.
- Comprehensive analysis: Power BI enables businesses to analyze various factors influencing forecasts, such as sales trends, market conditions, and external data sources. The ability to combine these factors in a single report allows businesses to gain a holistic view of their operations.
- Interactive dashboards: Power BI’s interactive dashboards allow users to explore different forecasting scenarios. Users can filter data, drill down into specific details, and visualize forecasted trends in real-time.
- Collaboration: Power BI enables collaborative forecasting by sharing forecasting visuals with teams across the organization. This encourages collaboration and ensures that everyone is aligned with the same forecasting goals and assumptions.
- Custom reports: Power BI allows users to create custom reports tailored to specific business needs. Whether it’s sales forecasting, demand planning, or financial predictions, Power BI provides flexibility to create reports that fit the requirements of different departments.
- Power BI’s built-in forecasting tools provide a powerful platform for business forecasting analysis, helping organizations make better-informed decisions and improve forecasting accuracy.
The Power of Power BI for Accurate Forecasting
- Power BI has become one of the most popular tools for accurate forecasting due to its ability to handle large datasets, integrate various forecasting techniques, and offer intuitive visuals. The forecasting features in Power BI provide businesses with the capability to forecast with high accuracy and ease. Why Power BI is powerful for forecasting:
- Ease of use: Power BI’s user-friendly interface allows even those with minimal data science experience to apply forecasting to their data and generate meaningful predictions.
- Flexibility: Power BI is not limited to a single forecasting technique. It supports a wide range of forecasting methods, including time series forecasting, exponential smoothing, and linear regression, making it suitable for different forecasting needs.
- Integration with advanced tools: For more complex scenarios, Power BI supports integration with Python or R scripts, allowing for advanced forecasting using data science techniques.
- Predictive capabilities: Power BI allows users to transform historical data into predictive models that can be used for business planning, budget forecasting, sales predictions, and more.
- By combining the power of Microsoft Power BI’s tools with advanced forecasting techniques, businesses can achieve accurate forecasting results and make data-driven decisions that drive growth.
Conclusion: Unlocking the Potential of Forecasting in Power BI
- Power BI unlocks a wealth of forecasting capabilities that enable businesses to accurately predict future trends and make informed decisions.
- Whether you are forecasting sales, analyzing demand, or planning for financial outcomes, forecasting in Power BI helps businesses use historical data to make predictions that are grounded in reality and driven by data.
- The integration of Power Query for data preparation, combined with visuals in Power BI, allows businesses to communicate forecasting results clearly and effectively.
- Power BI’s flexibility and advanced features, including DAX formulas, Python or R integration, and confidence intervals, enhance forecasting accuracy and allow for complex forecasting scenarios.
- With Power BI’s built-in forecasting, businesses can continuously monitor, adjust, and optimize their forecasts, ensuring they stay on top of market trends and changes. By using forecasting capabilities in Power BI, companies can transform their data into valuable insights that drive strategic planning and business success.
References
- Data Analysis Guide – Georgetown University Library – https://guides.library.georgetown.edu/data-analysis
- 5 Key Reasons Why Data Analytics Is Important for Business – University of Pennsylvania – https://lpsonline.sas.upenn.edu/features/5-key-reasons-why-data-analytics-important-business
- 10 Easy Data Analysis Methods and Techniques – Isenberg School of Management – https://iconnect.isenberg.umass.edu/blog/2024/06/06/10-easy-data-analysis-methods-and-techniques/
- Using Data for Analysis – Georgia Tech Library – https://libguides.library.gatech.edu/usingdata/analyzing-data