Power BI vs Tableau – Key Takeaways
- Overview:
- Power BI and Tableau are leading tools in business intelligence and data visualization.
- Both help data analysts transform raw data into insightful dashboards.
- Choosing depends on data source, data modeling, analytics needs, and AI features.
- Data Connectivity and Sources:
- Power BI integrates with Excel, SQL, Salesforce, and other datasets.
- Tableau connects to desktop, server, and cloud sources, including Tableau Cloud and Tableau Prep.
- Both support real-time data access and raw data connections.
- Data Preparation and Management:
- Power BI simplifies data prep and modeling with drag-and-drop interfaces.
- Tableau Prep and Tableau Desktop offer advanced preparation, calculation, and data management.
- Tableau allows data cleaning, reshaping, and blending before visualization.
- Visualization and Dashboarding:
- Power BI focuses on interactive dashboards, easy visualization, and AI insights.
- Tableau provides superior visualization with Tableau Pulse, Tableau Public, and detailed charts.
- Both allow natural language queries and interactive analytics.
- AI and Advanced Features:
- Power BI integrates predictive analytics and natural language AI features.
- Tableau incorporates AI for enhanced visualization and insights extraction.
- Deployment and Collaboration:
- Power BI is optimized for Microsoft environments with desktop or cloud deployment.
- Tableau supports Tableau Server, Tableau Cloud, and Tableau Desktop for enterprise management.
- Collaboration allows real-time dashboard sharing across teams.
- Use Case Scenarios:
- Use Power BI for Microsoft-centric workflows, Excel-heavy analysis, and integrated BI.
- Use Tableau for deep visualization, multi-source analysis, and flexible dashboard design.
Introduction: Power BI vs Tableau – Choosing the Right BI Tool
- Understanding Business Intelligence (BI) Needs:
- Businesses today rely on data visualization and analytics to make informed decisions.
- Selecting the right BI tool is critical for turning raw data into actionable insights through dashboards, reports, and visual analytics.
- Power BI vs Tableau in Context:
- Both Microsoft Power BI and Tableau are leading data visualization tools that offer extensive dashboard, AI features, and analytics capabilities.
- Choosing between them depends on your organization’s needs: whether you prioritize ease of use, data connectivity, AI capabilities, or complex visualization flexibility.
- Who Should Read This:
- Data analysts, BI professionals, and business teams looking to implement or migrate to a new BI tool.
- Decision-makers evaluating Microsoft Power BI vs Tableau for dashboarding, data visualization, or AI analytics.
What is Microsoft Power BI?
- Overview:
- Microsoft Power BI is a business intelligence platform designed to convert raw data into interactive dashboards and reports.
- Integrates seamlessly with Excel, SQL Server, Azure, and other Microsoft ecosystem products.
- Components of Power BI:
- Power BI Desktop: Desktop application for building data models, calculations, and visualizations.
- Power BI Service: Cloud-based platform to share dashboards, collaborate, and access reports in real time.
- Power BI Pro: Enables sharing and collaboration for teams.
- Power BI Premium: Enterprise-level features, large dataset handling, and advanced AI capabilities.
- Data Connectivity & Modeling:
- Connects to a variety of data sources: SQL databases, Excel, Salesforce, cloud storage, and more.
- Power Query allows data prep, data cleaning, and transforming raw data before analysis.
- Power BI’s DAX (Data Analysis Expressions) enables complex calculations and data modeling.
- Dashboard & Visualization:
- Create interactive dashboards with real-time updates.
- Leverages AI features for insights such as trend predictions, anomaly detection, and natural language queries.
- Data visualization capabilities include charts, maps, KPIs, and custom visualizations from the marketplace.
What is Tableau?
- Overview:
- Tableau is a data visualization tool focused on creating rich, interactive dashboards for analytics and data visualization.
- Offers multiple deployment options: Tableau Desktop, Tableau Prep, Tableau Server, Tableau Cloud, and Tableau Public.
- Components:
- Tableau Desktop: Build complex visualizations, calculations, and dashboards locally.
- Tableau Prep: For data preparation and data cleaning before visualization.
- Tableau Server & Tableau Cloud: Share dashboards, enable collaboration, and allow access from anywhere.
- Tableau Pulse: Real-time alerting and monitoring on key metrics.
- Data Connectivity:
- Connects to a wide range of data sources, including SQL, Excel, Salesforce, cloud storage, and APIs.
- Supports live connections or data extracts for efficient data management and data visualization.
- AI & Analytics:
- Tableau AI features assist in forecasting, anomaly detection, and natural language analysis.
- Allows embedding Python or R scripts for advanced analytics and data modeling.
- Visualization & Dashboards:
- Highly flexible dashboard creation with extensive data visualization capabilities.
- Tableau offers interactive filters, storyboards, and advanced mapping.
- Customers who choose Tableau often cite its visualization flexibility and data preparation tools.
Struggling with Your Data Analysis or Dissertation Statistics?
Get expert assistance with your data analysis projects or dissertation statistics from Best Dissertation Writers . Our team specializes in providing dissertation statistics help , ensuring accurate, well-analyzed results tailored to your research needs. Visit our site to get professional guidance and elevate the quality of your data-driven projects.
Get Professional HelpPower BI vs Tableau: Feature Comparison
- 1. Dashboard & Visualization:
- Power BI:
- Offers standard charts, maps, KPIs, and custom visuals.
- AI-powered insights automatically generate suggested visuals based on dataset trends.
- Tableau:
- Tableau also provides advanced visualization options like heatmaps, treemaps, and storyboards.
- More flexible dashboards for complex analytics compared to Power BI.
- Power BI:
- 2. Data Connectivity & Preparation:
- Power BI:
- Integrates well with Microsoft ecosystem including Excel, SQL Server, and Azure.
- Power Query supports data prep, cleaning, and transformation.
- Tableau:
- Tableau Prep provides sophisticated data cleaning and blending tools.
- Connects to multiple data sources, including Salesforce, cloud storage, and big data.
- Power BI:
- 3. AI & Analytics:
- Power BI’s AI features:
- Natural language queries with Q&A feature.
- Forecasting and anomaly detection within dashboards.
- Tableau AI capabilities:
- Statistical modeling and predictive analytics using Python or R.
- Automated insights for visualizations and alerts via Tableau Pulse.
- Power BI’s AI features:
- 4. Ease of Use & Learning Curve:
- Power BI: Easier for beginners, especially those familiar with Excel and Microsoft Power BI tools.
- Tableau: Steeper learning curve, but Tableau Desktop allows complex visualization and calculations.
- 5. Performance & Scalability:
- Power BI Premium supports large datasets and enterprise deployment.
- Tableau Server & Tableau Cloud handle large real-time data and multi-source data connectivity effectively.
- 6. Collaboration & Sharing:
- Power BI Service allows sharing dashboards within teams and organizations.
- Tableau Cloud and Server provide secure sharing, collaboration, and access across platforms.
Data Visualization Tools: Power BI and Tableau for Business Intelligence
- Role in BI:
- Both Power BI and Tableau transform raw data into actionable insights through data visualization and dashboarding.
- Enable data analysts and business users to make real-time decisions using AI features and analytics.
- Choosing Between Tools:
- Choose Tableau if you need advanced visualization, flexibility, or complex dashboards.
- Use Power BI for cost-effective, integrated Microsoft ecosystem BI, especially if using Excel, SQL, or Azure.
- Key Considerations for Decision-Makers:
- Data connectivity: If multiple non-Microsoft sources are used, Tableau may be better.
- Dashboard complexity: Tableau offers richer visualization options.
- AI features: Both tools support AI; Power BI integrates with Azure AI, while Tableau also allows predictive analytics via Python/R.
- Collaboration & Sharing: Tableau Server/Cloud or Power BI Service/Pro enable enterprise-wide access.
- Integration with Other Tools:
- Microsoft Power BI: Works seamlessly with Excel, Azure, Power BI Desktop, and Power BI Service.
- Tableau: Integrates with SQL, Salesforce, Tableau Prep, Tableau Cloud, and Tableau Public.
- Data Preparation & Modeling:
- Power BI’s Power Query allows complex data prep and data modeling.
- Tableau Prep helps clean and transform raw data before visualization.
- Advanced Analytics:
- Power BI’s DAX enables sophisticated calculations and data transformations.
- Tableau Desktop and Tableau Prep support data analysis, predictive modeling, and AI-powered insights.
- Real-Time Insights:
- Tableau Pulse and Power BI Service dashboards provide real-time monitoring and reporting.
- Both power bi and tableau allow automatic updates when datasets change.
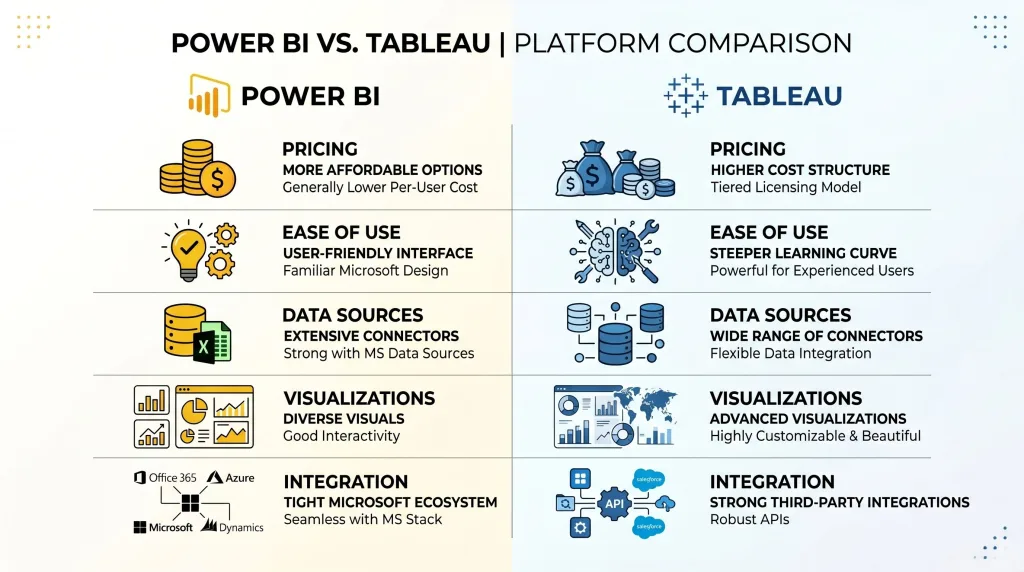
| Category | Power BI | Tableau |
|---|---|---|
| Vendor | Microsoft | Salesforce |
| Best For | Microsoft ecosystem, Excel users, cost-conscious teams | Advanced visualizations, flexible dashboards, complex analytics |
| Deployment | Desktop, Service, Pro, Premium | Desktop, Prep, Server, Cloud |
| Data Connectivity | SQL, Excel, Azure, cloud services | Broad database support, Salesforce, cloud, big data |
| Data Prep & Modeling | Power Query, DAX for calculations | Tableau Prep Builder, strong blending and modeling |
| AI & Analytics | Natural language Q&A, predictive insights | Forecasting, Python/R integration, Tableau Pulse alerts |
| Visualizations & Dashboards | Standard charts, KPIs, custom visuals | Highly flexible, advanced visualization types, interactive dashboards |
| Collaboration | Power BI Service for sharing and commenting | Tableau Server/Cloud for secure sharing and real-time dashboards |
| Ease of Use | Beginner-friendly, familiar for Excel users | Steeper learning curve, more flexible for analysts |
| Cost | Lower TCO; scalable from Pro to Premium | Higher cost; Creator/Explorer/Viewer roles |
Deep Dive into Power BI: AI and Analytics in Action
- Overview of Power BI for Analytics:
- Power BI is a leading business intelligence tool that enables advanced data visualization, analytics, and interactive dashboards.
- Power BI users can convert raw data into actionable insights by leveraging AI features, key performance indicators, and visualization types.
- AI Capabilities in Power BI:
- Natural language queries: Users can ask questions using plain language, and Power BI generates visuals automatically.
- Predictive analytics: Built-in AI features forecast trends, detect anomalies, and provide recommendations.
- Automated insights: Power BI supports automatic identification of patterns in data in Power BI, helping analysts spot opportunities quickly.
- Data Preparation and Modeling:
- Power Query allows cleaning, transforming, and shaping data connections from multiple sources, including SQL, Excel, and cloud-based services.
- Data modeling capabilities enable calculation of complex metrics and relationships across multiple datasets.
- Power BI’s DAX (Data Analysis Expressions) empowers advanced calculations and aggregations, which are critical for key performance indicators.
- Dashboards and Visualization:
- Visualization types include bar charts, line charts, scatter plots, maps, KPIs, and custom visuals from the marketplace.
- Power BI integrates seamlessly with Microsoft Excel and Azure, enhancing data management and reporting workflows.
- Real-time dashboards allow Power BI users to monitor operational metrics and share insights across teams efficiently.
- Collaboration and Sharing:
- With Power BI Service, users can share insights across the organization securely.
- Power BI Pro and Power BI Premium provide enhanced collaboration and enterprise-scale data handling.
- Teams can compare Power BI and Tableau dashboards to see how insights perform in real-time scenarios.
- Why Choose Power BI for AI and Analytics:
- Affordable total cost of ownership for small to medium enterprises.
- Ideal for organizations deeply embedded in the Microsoft ecosystem.
- Strong AI capabilities, data modeling, and advanced visualization make it a robust BI tool.
Customers Who Chose Tableau: Why Tableau Stands Out
- Overview of Tableau for Visualization:
- Tableau offers superior data visualization tools that emphasize interactivity, flexibility, and advanced data visualization.
- Tableau and Power BI share the goal of converting raw data into actionable insights, but Tableau also offers unmatched visualization flexibility.
- Visualization Strengths:
- Tableau Desktop and Tableau Creator provide highly customizable dashboards and visualization types.
- Users can combine multiple datasets and create complex calculations, enabling superior data storytelling.
- Tableau Prep Builder supports data preparation, blending, and cleaning for clean and accurate data visualization.
- Deployment and Sharing Options:
- Tableau Server or Tableau Online enable organizations to share insights across teams with role-based security.
- Tableau Server and Tableau Cloud provide real-time dashboards, monitoring, and alerts.
- Customers who choose Tableau often cite its superior data visualization capabilities and flexibility in handling multiple data connections.
- AI and Analytics:
- Tableau also offers predictive analytics through integrations with Python and R.
- Embedded AI features allow data analysts to forecast trends, detect anomalies, and enhance data modeling.
- Tools like Tableau Pulse provide real-time alerts for critical metrics and key performance indicators.
- Community and Learning:
- Tableau Conference showcases innovations and provides learning for data analysts and developers.
- Tableau Public fosters a community for sharing visualization techniques and templates.
- Organizations often choose Tableau for its strong support, flexibility, and superior data visualization capabilities.
- Why Customers Prefer Tableau:
- Advanced dashboard interactivity compared to Power BI.
- Highly flexible visualization types for complex datasets.
- Strong community and support ecosystem for ongoing learning and updates.
- Seamless integration with multiple data sources, including Salesforce, cloud, and SQL databases.
Struggling with Your Data Analysis or Dissertation Statistics?
Get expert assistance with your data analysis projects or dissertation statistics from Best Dissertation Writers . Our team specializes in providing dissertation statistics help , ensuring accurate, well-analyzed results tailored to your research needs. Visit our site to get professional guidance and elevate the quality of your data-driven projects.
Get Professional HelpHow to Choose Tableau or Microsoft Power BI: The Right Data Visualization Tool for You
- Evaluate Your Organizational Needs:
- Consider data sources, volume, and frequency of updates (real-time vs batch).
- Assess whether your organization is primarily using Microsoft tools, which favors Power BI, or multiple external data sources, which may favor Tableau.
- Consider Total Cost of Ownership:
- Power BI Pro and Power BI Premium offer competitive pricing, especially for Microsoft Power BI users.
- Tableau Creator licenses may have higher upfront costs, but provide superior data visualization capabilities and flexibility for enterprise-grade analytics.
- Advanced Data Visualization Needs:
- If your team requires highly customizable dashboards, complex calculations, or storytelling through data, choose Tableau.
- If your priority is integration with Microsoft Excel, SQL, or Azure, and simple dashboards with strong AI features, prefer Power BI.
- Collaboration and Sharing:
- Power BI Service and Tableau Server or Tableau Online allow sharing of dashboards and insights across teams.
- Evaluate whether your organization needs desktop-only solutions or cloud-based collaboration.
- AI Features and Analytics:
- Power BI supports natural language queries, predictive analytics, and AI insights.
- Tableau also offers AI-driven forecasts, Python/R integration, and real-time alerts.
- Consider the depth of AI capabilities needed for your team when deciding between Power BI and Tableau.
- Data Preparation and Modeling:
- Power BI’s Power Query enables data prep and modeling directly in the desktop application.
- Tableau Prep Builder allows advanced cleaning, transformation, and blending of raw data before visualization.
- Teams that handle complex datasets may choose Tableau for superior data visualization and preparation tools.
- User Skill and Learning Curve:
- Power BI is intuitive for Microsoft users and those familiar with Excel and SQL.
- Tableau Desktop requires more training but provides superior data visualization capabilities for experienced analysts.
- Decide based on your team’s technical expertise and long-term adoption goals.
- Decision-Making Matrix:
- Power BI: Best for Microsoft-centric environments, cost-effective BI tool, fast deployment, and AI integration.
- Tableau: Ideal for advanced data visualization, flexible dashboards, and enterprise-level analytics.
- Compare Power BI and Tableau to determine which aligns with data management, AI needs, and user skill levels.
Conclusion: Power BI vs Tableau – Which BI Tool Should You Choose?
- Recap of Key Differences Between Power BI and Tableau:
- Power BI and Tableau may seem similar, but they serve different needs: Power BI excels in integration with Microsoft products and ease of use, while Tableau offers superior data visualization and flexibility.
- Differences between Power BI and Tableau include visualization types, AI capabilities, data prep tools, and collaboration options.
- Choosing the Right Tool:
- Assess your total cost of ownership, deployment preferences (desktop vs cloud), and dashboard complexity.
- Consider Power BI and Tableau share strengths in AI, analytics, and data visualization, but your priority (cost, integration, advanced visualizations) determines the final choice.
- Final Thoughts on Power BI vs Tableau:
- Power BI is ideal for organizations with Microsoft infrastructure, simpler dashboards, and strong AI features.
- Tableau is perfect for enterprises seeking advanced visualization, flexible dashboards, and rich data modeling.
- Both Power BI and Tableau are excellent BI tools; the right choice depends on your data ecosystem, analytical needs, and team capabilities.
- Recommendation:
- For organizations seeking affordability, fast deployment, and Microsoft integration, prefer Power BI.
- For organizations needing superior data visualization capabilities, flexibility, and complex analytics, choose Tableau.
- Conduct a pilot project with tableau and power bi to evaluate performance, AI insights, and dashboard usability before committing.
References
- Data Analysis Guide – Georgetown University Library – https://guides.library.georgetown.edu/data-analysis
- 5 Key Reasons Why Data Analytics Is Important for Business – University of Pennsylvania – https://lpsonline.sas.upenn.edu/features/5-key-reasons-why-data-analytics-important-business
- 10 Easy Data Analysis Methods and Techniques – Isenberg School of Management – https://iconnect.isenberg.umass.edu/blog/2024/06/06/10-easy-data-analysis-methods-and-techniques/
- Using Data for Analysis – Georgia Tech Library – https://libguides.library.gatech.edu/usingdata/analyzing-data