What is a Quantitative Research?
- Quantitative research is a type of research that collects and studies numerical data.
- In simple terms, quantitative research uses numbers to answer research questions.
- It focuses on measuring facts, patterns, behaviours, opinions, test scores, relationships between variables, or differences between groups.
- For example, a researcher may ask, “How many students passed the test after using a new study method?” or “What percentage of customers prefer online shopping?”
- These questions require numerical data, which makes quantitative research useful when the researcher wants clear, measurable results.
- Quantitative research collects numerical data that can be analysed using statistical methods.
- This means the research data is not mainly based on personal stories or long written opinions.
- Instead, quantitative research uses structured data collection methods such as surveys, questionnaires, tests, experiments, observations with rating scales, and secondary data.
- The researcher then applies statistical analysis to explain the findings.
- This helps make the research findings more objective and easier to compare.
- Quantitative research is different from qualitative research.
- Qualitative research collects non-numerical data, such as interviews, opinions, feelings, meanings, and personal experiences.
- Quantitative research, on the other hand, focuses on numbers, measurement, and statistical evidence.
- However, quantitative and qualitative methods can sometimes be used together in one research study.
- This is called mixed methods, where qualitative and quantitative data help explain the research problem more fully.
- Quantitative research is often used to test hypotheses.
- A hypothesis is a prediction about what the researcher expects to find.
- For example, a researcher may predict that students who study for more hours will get higher test scores.
- Quantitative research can test hypotheses by measuring two or more variables and checking whether a relationship exists.
- This is why quantitative research design is important. The study design must align with the research question, hypothesis, data collection, and data analysis.
- Quantitative research is useful in many fields.
- It is used in education, healthcare, business, psychology, social sciences, market research, and fundamental research.
- In market research, quantitative research may measure customer satisfaction.
- In education, quantitative studies may compare test score results.
- In healthcare, quantitative research methods may measure the effect of a treatment on patient recovery.
- In business, quantitative methods may help compare sales before and after a marketing campaign.
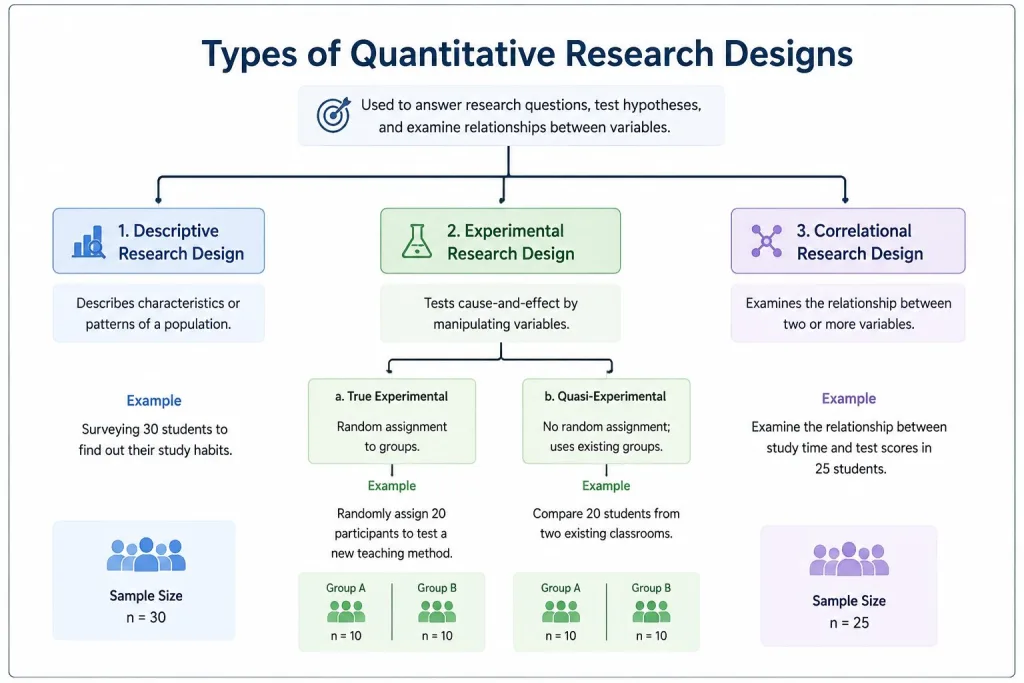
Types of Quantitative Research Designs, with Examples
- A research design refers to the plan a researcher follows to answer the research question.
- In quantitative research, the research design explains how the researcher will collect quantitative data, measure variables, analyse results, and draw conclusions.
- A good quantitative research design makes the research process clear and organised.
- It also supports reliability and validity because the methodology is planned before data collection begins.
- There are several types of quantitative research design, and each design type is used for a different purpose.
- The main types of quantitative research design include descriptive, correlational, comparative, quasi-experimental, and experimental design.
- These research design types help the researcher decide how to collect data and how to answer research questions.
- Some design types only describe a situation.
- Others examine correlation between two or more variables.
- Some compare groups.
- Others test a cause-and-effect relationship through manipulation of variables.
1. Descriptive Research Design
- Descriptive research is used to describe a population, situation, behaviour, or trend.
- This type of quantitative research does not try to explain why something happens.
- It simply answers questions such as what, how many, how often, or what percentage.
- Descriptive research is useful when the researcher wants to understand the current condition of a topic.
- Example of descriptive research:
- A researcher may study how many university students use online learning platforms every week.
- The researcher may collect quantitative data through survey research.
- The survey may ask students how often they log in, how many hours they study online, and which tools they use most.
- The data analysis may show percentages, averages, and frequency patterns.
- Why this design is useful:
- It gives a clear picture of the research problem.
- It is helpful for large samples.
- It is often used in market research, education, public health, and social research.
- However, descriptive research cannot explain cause and effect.
Need Help With Your Dissertation?
Get professional academic support from Best Dissertation Writers . Our expert team is ready to help you with high-quality dissertation writing services tailored to your academic goals.
Get Dissertation Help2. Correlational Research Design
- Correlational research examines relationships between variables.
- A correlational design is used when the researcher wants to know whether two or more variables are connected.
- The researcher does not manipulate the variables.
- Instead, the researcher measures the variables and uses statistical analysis to check the strength and direction of the relationship.
- Example of correlational research:
- A researcher may study the relationship between study hours and exam test score results.
- Study hours may be one variable.
- Test score may be another variable.
- If students who study longer usually score higher, there may be a positive correlation.
- Important limitation:
- Correlational research cannot prove that one variable causes another.
- For example, even if study hours and test scores are related, other factors may also affect performance.
- This is why correlational research cannot confirm a cause-and-effect relationship.
3. Comparative Research Design
- Comparative research compares two or more groups.
- A comparative design is useful when the researcher wants to know whether groups are different based on a measured outcome.
- The design involves comparing numerical data from different categories of participants.
- This type of research is often used when manipulation of variables is not possible or ethical.
- Example of comparative research:
- A researcher may compare the average test score of students who attend online classes with those who attend face-to-face classes.
- The dependent variable may be the test score.
- The group type may be the independent variable.
- Statistical analysis can show whether there is a significant difference between the groups.
- Why this design is useful:
- It helps researchers understand group differences.
- It can support decision-making in schools, businesses, and health organisations.
- However, comparative research may not fully prove causation unless the design controls other factors carefully.
4. Quasi-Experimental Research Design
- Quasi-experimental research is used to study cause-and-effect relationships without full random assignment.
- This quantitative research design is close to experimental research, but participants are not randomly placed into groups.
- It is often used in real-life settings where random assignment is difficult.
- For example, a school may already have existing classrooms, so the researcher cannot randomly move students into different groups.
- Example of quasi-experimental research:
- A researcher may test whether a new teaching method improves student performance.
- One class may use the new method.
- Another class may continue using the old method.
- The researcher compares test score results before and after the intervention.
- Why this design is useful:
- It works well in natural settings.
- It can still give useful evidence about possible effects.
- However, because participants to groups are not randomly assigned, other factors may influence the results.
5. Experimental Research Design
- Experimental research design is the strongest design for testing cause and effect.
- In experimental research, the researcher controls one or more independent variables and measures the effect on a dependent variable.
- The independent variable is what the researcher changes.
- The dependent variable is what the researcher measures.
- A control group is often used for comparison.
- Example of experimental research:
- A researcher may test whether a new reading programme improves children’s reading scores.
- One group receives the new programme.
- The control group continues with the normal programme.
- After a set period, the researcher compares the reading test score results of both groups.
- Why this design is important:
- Experimental research can test hypotheses more strongly than other design types.
- It allows the researcher to examine a cause-and-effect relationship.
- It is common in medicine, psychology, education, and scientific studies.
- However, experimental research design may require more time, planning, and ethical control.
6. Cross-Sectional Quantitative Research Design
- A cross-sectional design collects data at one point in time.
- This quantitative research design is useful when the researcher wants a quick picture of a population.
- It is commonly used in survey research.
- It can measure opinions, behaviours, health conditions, or social patterns at a specific moment.
- Example of cross-sectional research:
- A researcher may survey 500 employees to measure job satisfaction in one month.
- The research collects data once.
- The results may show the percentage of employees who are satisfied, neutral, or dissatisfied.
- Why this design is useful:
- It is usually faster and less costly than long-term research.
- It works well for descriptive and comparative research.
- However, it cannot show changes over time.
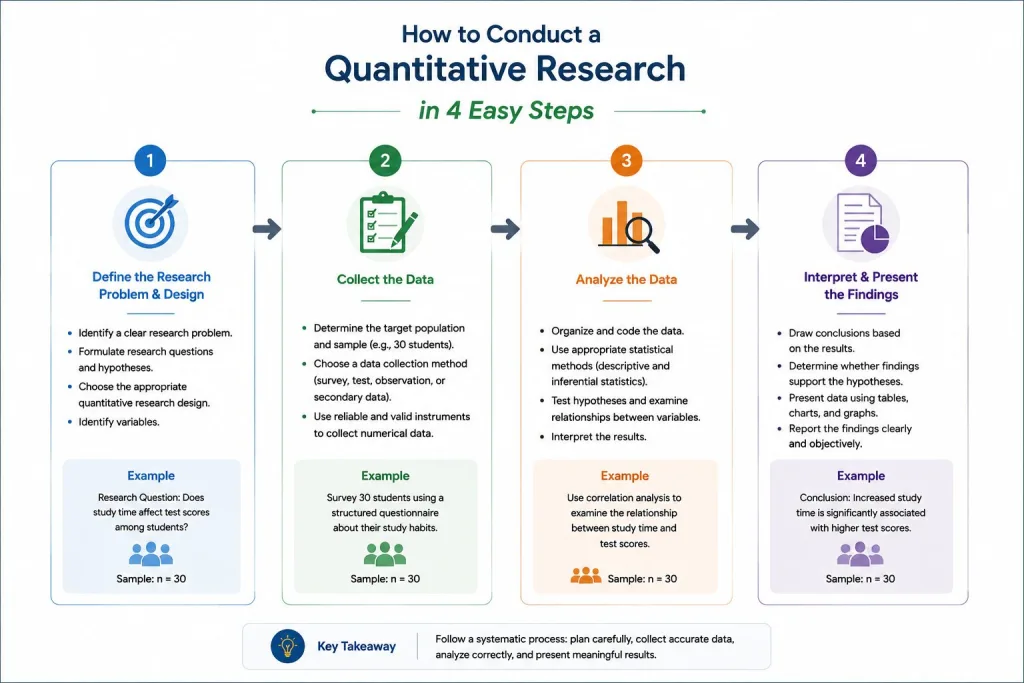
How to Conduct a Quantitative Research in 4 Easy Steps
Step 1: Identify the Research Problem and Research Question
- The first step in quantitative research is to define the research problem clearly.
- A research problem is the issue, gap, or question that the researcher wants to investigate.
- The problem should be specific enough to be measured using quantitative data.
- For example, “students are not performing well” is too broad.
- A better research problem may be, “Grade 10 students have lower mathematics test scores after switching to online learning.”
- After identifying the research problem, create a clear research question.
- The research question guides the whole research study.
- In quantitative research, the research question should focus on measurement, comparison, relationship, or effect.
- For example:
- What percentage of customers are satisfied with the new service?
- Is there a relationship between screen time and sleep quality?
- Does a new training programme improve employee performance?
- Are there differences in test score results between online and classroom students?
- The research question should align with your research design.
- If the question asks “how many” or “how often,” descriptive research may be suitable.
- If the question asks about relationships between variables, correlational research may be suitable.
- If the question asks whether one thing causes another, experimental research design may be suitable.
- This alignment between research design and data is important because the wrong design can lead to weak findings.
- The researcher should also develop a hypothesis when needed.
- A hypothesis is commonly used in quantitative studies.
- It predicts the expected relationship between variables.
- For example, “Students who spend more time studying will have higher test scores.”
- This hypothesis can then be tested through statistical analysis.
Step 2: Choose the Right Quantitative Research Design
- The second step is to select the most suitable quantitative research design.
- The design refers to the structure of the study.
- It explains how the researcher will collect quantitative data and analyse it.
- Choosing the right design helps the researcher answer the research question correctly.
- The researcher should choose from several types of quantitative research design.
- If the goal is to describe a population, use descriptive research.
- If the goal is to examine correlation, use correlational research.
- If the goal is to compare groups, use comparative research.
- If the goal is to test an intervention without random assignment, use quasi-experimental research.
- If the goal is to test cause and effect with control, use experimental research.
- The researcher must identify the variables.
- Variables are the things being measured in the research study.
- In experimental research, the independent variable is changed or controlled by the researcher.
- The dependent variable is the outcome being measured.
- For example, in a study about teaching methods and test scores, the teaching method may be the independent variable, while test score may be the dependent variable.
- The researcher must also decide whether a control group is needed.
- A control group is a group that does not receive the treatment or intervention.
- It is important in experimental design because it helps the researcher compare results.
- For example, if one group receives a new medication and the control group receives standard care, the researcher can compare the outcomes.
- This makes it easier to understand whether the independent variable affected the dependent variable.
- The study design should support reliability and validity.
- Reliability means the research method can produce consistent results.
- Validity means the research measures what it is supposed to measure.
- A strong quantitative research design improves both reliability and validity.
- This makes the research findings more trustworthy.
Step 3: Select Data Collection Methods and Collect Quantitative Data
- The third step is data collection.
- Data collection is the process of gathering the information needed to answer the research question.
- In quantitative research, the researcher uses methods to gather numerical data.
- These data collection methods must match the research design methods chosen earlier.
- Common quantitative data collection methods include surveys, questionnaires, tests, experiments, observations, and secondary data.
- Survey research is one of the most common quantitative research methods.
- Surveys can collect data from many participants quickly.
- Questionnaires can ask closed-ended questions, rating scale questions, and multiple-choice questions.
- Tests can measure knowledge, skills, performance, or achievement.
- Experiments can measure the effect of one or more independent variables.
- Secondary data can come from existing records, reports, databases, or previous studies.
- Quantitative data collection should be structured.
- Structured data collection means all participants answer the same or similar questions.
- This makes the results easier to compare.
- For example, a customer satisfaction survey may ask all customers to rate service quality from 1 to 5.
- These ratings create numerical data that can be analysed statistically.
- The researcher must decide who will participate in the research.
- Participants should be selected based on the research problem and research question.
- In some studies, the researcher uses a sample from a larger population.
- For example, instead of surveying every student in a country, the researcher may survey 500 students from selected schools.
- A good sample helps make the research findings more useful.
- The researcher should also consider ethics.
- Participants should understand the purpose of the research.
- They should not be forced to participate.
- Their privacy should be protected.
- Ethical data collection protects participants and improves the quality of the research process.
Step 4: Analyse the Data and Present the Findings
- The final step is data collection and analysis.
- After the researcher collects quantitative data, the next task is quantitative data analysis.
- Quantitative data analysis involves organising, summarising, and interpreting numerical data.
- The researcher uses appropriate descriptive and inferential statistics depending on the research question and design.
- Descriptive statistics help summarise the data.
- Descriptive statistics include percentages, means, medians, ranges, and standard deviations.
- For example, a researcher may report that 75% of customers are satisfied with a service.
- Descriptive statistics are useful in descriptive research and survey research.
- They help readers understand the main patterns in the data.
- Inferential statistics help test hypotheses.
- Inferential statistics are used when the researcher wants to make conclusions beyond the sample.
- They can help test whether a relationship, difference, or effect is statistically significant.
- For example, statistical analysis can show whether students taught with a new method scored significantly higher than students in a control group.
- This helps answer research questions more clearly.
- The researcher should interpret the findings carefully.
- The findings should be linked back to the research question, hypothesis, and methodology.
- The researcher should explain what the numbers mean in simple language.
- For example, instead of only saying “there was a significant correlation,” the researcher should explain what the correlation means in the real world.
- This makes the research paper easier to understand.
- The researcher should also explain the limitations.
- Every quantitative research study has limits.
- For example, a small sample may limit the strength of the findings.
- A cross-sectional study may not show changes over time.
- Correlational research cannot prove causation.
- Explaining these limits makes the research more honest and credible.
- Finally, present the research findings clearly.
- Use tables, charts, graphs, and short explanations.
- Avoid confusing readers with too many statistics.
- Make sure the results answer the research question directly.
- A good quantitative research paper connects the research problem, design, data collection, statistical analysis, and conclusions in a clear way.
Philosophical Assumptions of The Quantitative Research Designs
- Quantitative research is based on the belief that reality can be measured.
- One major philosophical assumption of quantitative research is that many social, scientific, and behavioural issues can be studied through measurement.
- This means the researcher believes that facts, patterns, and relationships can be observed, counted, and analysed.
- For example, student achievement can be measured using test score data.
- Customer satisfaction can be measured using rating scales.
- Health improvement can be measured using numerical indicators.
- Quantitative research often follows a positivist or post-positivist view.
- Positivism assumes that knowledge should be based on observable evidence.
- In this view, research uses objective measurement and statistical analysis.
- Post-positivism accepts that research may not be perfectly objective, but it still values evidence, testing, and careful methodology.
- This is why quantitative research design methods focus on structure, measurement, reliability, and validity.
- Quantitative research assumes that variables can be identified and measured.
- A variable is something that can change or vary.
- In quantitative research, the researcher identifies variables and studies how they behave.
- In experimental research, the researcher may study independent and dependent variables.
- In correlational research, the researcher may examine relationships between variables.
- In comparative research, the researcher may compare numerical data across groups.
- Quantitative research assumes that statistical analysis can support conclusions.
- Quantitative research uses statistical tools to make sense of data.
- These tools help the researcher test hypotheses, compare groups, measure correlation, and identify patterns.
- The goal is not just to collect numbers, but to use numbers to answer research questions.
- This makes quantitative research useful when a study requires clear evidence.
- Quantitative research values objectivity.
- The researcher tries to reduce personal bias by using structured tools, clear procedures, and consistent measurement.
- This does not mean quantitative research is perfect.
- Poor design, weak sampling, or unclear data collection can still affect the results.
- However, a strong quantitative research design helps make the research process more transparent and trustworthy.
- Quantitative research also has limits.
- One of the cons of quantitative research is that it may not fully explain human feelings, meanings, or personal experiences.
- This is where qualitative methods may be helpful.
- For example, quantitative research can show that 60% of workers are dissatisfied, but qualitative research can explain why they feel that way.
- Therefore, the pros and cons of quantitative research should be considered before choosing a study design.
Data Collection Methods in Quantitative Research
- Data collection is one of the most important stages in quantitative research.
- In quantitative research, data collection means gathering information that can be measured, counted, and analysed statistically.
- The main goal is to collect quantitative data that can answer the research question clearly.
- Since quantitative research collects numerical data, the researcher must use structured tools that produce numbers.
- These numbers may come from surveys, tests, experiments, observations, existing records, or digital tracking systems.
- The data collection method should always align with your research design, research problem, hypothesis, and overall methodology.
- A strong quantitative research design depends on accurate data collection.
- If the data collection methods are weak, the research findings may also be weak.
- For example, if a survey question is confusing, participants may give inaccurate answers.
- If a test score is not measured fairly, the results may not reflect the real performance of participants.
- This is why reliability and validity are very important in quantitative research.
- Reliability means the research method gives consistent results.
- Validity means the research collects the type of data it is supposed to collect.
1. Surveys and Questionnaires
- Survey research is one of the most common data collection methods in quantitative research.
- A survey is used to collect information from many participants in a structured way.
- In quantitative research, surveys usually include closed-ended questions.
- These may include multiple-choice questions, yes-or-no questions, rating scale questions, or ranking questions.
- For example, a market research survey may ask customers to rate service quality from 1 to 5.
- These responses become numerical data that can be used for quantitative data analysis.
- Surveys are useful when the researcher wants to study opinions, behaviours, attitudes, or patterns.
- For example, a researcher may use quantitative research to find out how many students prefer online learning.
- Another researcher may use survey research to measure customer satisfaction.
- A healthcare researcher may ask patients to rate their pain level before and after treatment.
- In each case, quantitative research uses structured questions to collect measurable data.
- Surveys work well with descriptive research and cross-sectional study design.
- Descriptive research uses surveys to describe what is happening in a population.
- A cross-sectional survey collects data at one point in time.
- For example, a researcher may survey 500 employees in one month to measure workplace satisfaction.
- This type of quantitative research is useful because it is often quick, affordable, and easy to analyse.
2. Tests and Standardised Assessments
- Tests are another important method used to collect quantitative data.
- Tests are commonly used in education, psychology, healthcare, and training research.
- A test score can measure knowledge, skill, achievement, memory, performance, or ability.
- For example, a researcher may compare mathematics test score results before and after a new teaching programme.
- Since the result is numerical, it fits well with quantitative research methods.
- Tests are useful when the research question focuses on performance or improvement.
- For example, a research question may ask, “Does a new reading strategy improve student test scores?”
- In this case, the researcher may collect test score data before and after the intervention.
- The independent variable may be the reading strategy.
- The dependent variable may be the reading test score.
- This method is common in experimental research design and quasi-experimental research.
- Standardised tests can improve reliability and validity.
- A standardised test is given and scored in the same way for all participants.
- This helps reduce bias in the research process.
- It also makes it easier to compare results between groups.
- However, the researcher must make sure the test matches the research problem and is suitable for the participants.
3. Experiments
- Experiments are used when the researcher wants to test a cause-and-effect relationship.
- In experimental research, the researcher changes one or more independent variables and measures the effect on a dependent variable.
- This manipulation of variables makes experimental design different from descriptive research and correlational research.
- A control group is often used to compare results.
- The control group does not receive the treatment or intervention, while the experimental group does.
- Example of experimental data collection:
- A researcher may want to know whether a new fitness programme improves weight loss.
- One group follows the new fitness programme.
- The control group continues with their normal routine.
- After eight weeks, the researcher measures weight change in both groups.
- The data collected is numerical and can be analysed using statistical analysis.
- Experiments are common in scientific, medical, educational, and psychological quantitative studies.
- Experimental research design is powerful because it can test hypotheses more directly.
- However, it requires careful planning.
- The researcher must consider ethics, participant safety, random assignment, and control of outside factors.
- If participants to groups are not randomly assigned, the study may become quasi-experimental rather than fully experimental.
4. Structured Observation
- Structured observation is used when the researcher watches and records measurable behaviour.
- Unlike qualitative observation, which may focus on detailed descriptions, quantitative research uses observation in a structured way.
- The researcher decides in advance what behaviour will be counted or measured.
- For example, a researcher may count how many times students raise their hands during class.
- Another researcher may record how long customers wait in a queue.
- Structured observation is useful when behaviour can be counted.
- It can be used in classrooms, hospitals, workplaces, public spaces, and business settings.
- For example, in market research, a company may observe how many customers enter a shop during different times of the day.
- The data collection produces numerical data such as frequency, duration, or percentage.
- This makes the method suitable for quantitative research.
- The researcher must use clear observation rules.
- All observations should be recorded in the same way.
- This supports reliability and validity.
- If two researchers observe the same behaviour, they should record similar results.
- This makes the research data more trustworthy.
5. Secondary Data
- Secondary data refers to data that already exists.
- In quantitative research, secondary data may come from government reports, school records, hospital databases, company sales reports, census data, or previous quantitative studies.
- The researcher does not collect the original data directly from participants.
- Instead, the researcher analyses existing numerical data to answer the research question.
- Secondary data is useful when the researcher wants to save time and resources.
- For example, a researcher studying unemployment trends may use national labour statistics.
- A school researcher may use past test score records.
- A business researcher may analyse monthly sales data.
- This type of quantitative research can be useful for trend analysis, comparative research, and descriptive research.
- However, secondary data must be checked carefully.
- The researcher must ask whether the data is accurate, current, complete, and relevant.
- If the data was collected for a different purpose, it may not fully answer the current research question.
- The researcher should also check how the original data was collected.
- This helps protect the quality of the quantitative research study.
6. Digital and Automated Data Collection
- Modern quantitative research can also use digital data collection tools.
- These tools may include website analytics, mobile apps, wearable devices, online forms, customer management systems, or learning platforms.
- For example, a researcher may collect quantitative data on how many users click a button on a website.
- Another researcher may measure how many minutes students spend on an online learning platform.
- This type of research collects numerical data automatically.
- Digital data collection is useful because it can collect large amounts of data quickly.
- It is common in market research, education technology, healthcare, and business analytics.
- However, the researcher must still follow ethical rules.
- Participants should know how their data is being used when personal data is involved.
- Privacy and data protection are important parts of responsible quantitative research.
Data Analysis Methods in Quantitative Research
- Data analysis is the process of making meaning from numerical data.
- In quantitative research, data analysis helps the researcher organise, summarise, compare, and interpret research data.
- Quantitative data analysis usually involves statistical tools.
- These tools help answer research questions, test hypotheses, and explain relationships between variables.
- A strong quantitative research design should plan the data analysis before data collection begins.
- The data analysis method must match the research design.
- Descriptive research may require percentages, means, and frequency tables.
- Correlational research may require correlation analysis.
- Comparative research may require tests that compare two or more groups.
- Experimental research may require analysis that compares a control group and experimental group.
- This is why research design and data analysis must work together.
1. Descriptive Statistics
- Descriptive statistics are used to summarise quantitative data.
- They help the researcher explain what the data looks like.
- Common descriptive statistics include frequencies, percentages, mean, median, mode, range, and standard deviation.
- For example, a researcher may report that 68% of customers are satisfied with a service.
- Another researcher may report the average test score of students after a training programme.
- Descriptive statistics are useful in many types of quantitative research design.
- They are especially common in descriptive research and survey research.
- They help readers understand the main findings quickly.
- For example, a market research report may show the percentage of customers who prefer one product over another.
- This makes descriptive statistics one of the most basic but important quantitative methods.
- Examples of descriptive statistics in quantitative research include:
- The average age of participants.
- The percentage of students who passed a test.
- The number of customers who selected each product.
- The highest and lowest test score.
- The standard deviation of exam results.
Need Help With Your Dissertation?
Get professional academic support from Best Dissertation Writers . Our expert team is ready to help you with high-quality dissertation writing services tailored to your academic goals.
Get Dissertation Help2. Inferential Statistics
- Inferential statistics are used to make conclusions beyond the sample.
- In many quantitative studies, the researcher collects data from a sample instead of the whole population.
- Inferential statistics help the researcher decide whether the findings may apply to the larger population.
- They also help test hypotheses and determine whether results are statistically significant.
- This makes inferential statistics important in quantitative research methods.
- Inferential statistics are often used in experimental research, correlational research, and comparative research.
- For example, a researcher may want to know whether a new teaching method really improved student test scores.
- The researcher can use statistical analysis to test whether the difference between groups is meaningful.
- If the result is statistically significant, the researcher may conclude that the difference is unlikely to be due to chance alone.
- Common inferential tests include:
- t-tests, which compare the means of two groups.
- ANOVA, which compares the means of three or more groups.
- Chi-square tests, which examine relationships between categories.
- Regression analysis, which studies how one or more independent variables predict a dependent variable.
- Correlation tests, which measure relationships between variables.
3. Correlation Analysis
- Correlation analysis is used to measure the relationship between two or more variables.
- It is commonly used in correlational research.
- A correlation can be positive, negative, or weak.
- A positive correlation means both variables increase together.
- A negative correlation means one variable increases while the other decreases.
- A weak correlation means the relationship is small or unclear.
- Example of correlation in quantitative research:
- A researcher may study the relationship between study hours and exam test score.
- If students who study more usually score higher, the variables may have a positive correlation.
- A researcher may also study the relationship between stress level and sleep hours.
- If higher stress is linked with fewer sleep hours, the variables may have a negative correlation.
- Correlational research cannot prove causation.
- This is an important limitation.
- Even if two variables are related, one variable may not directly cause the other.
- For example, if exercise and happiness are related, it does not automatically mean exercise causes happiness.
- Other variables may also influence the result.
4. Regression Analysis
- Regression analysis is used to predict or explain a dependent variable.
- It helps the researcher understand how one or more independent variables relate to an outcome.
- For example, a researcher may use income, education level, and work experience to predict job satisfaction.
- In this case, job satisfaction is the dependent variable.
- Income, education, and work experience are independent variables.
- Regression is useful when quantitative research involves prediction.
- It is often used in business, economics, education, health, psychology, and market research.
- For example, a company may use regression to predict sales based on advertising spending.
- A school may use regression to predict test score performance based on attendance and study time.
- This makes regression one of the most useful quantitative research methods for complex research questions.
- Regression analysis can support stronger data analysis.
- It can show which variables have the strongest relationship with the outcome.
- It can also help control for other variables.
- However, regression results must be interpreted carefully.
- A relationship does not always prove a cause-and-effect relationship unless the research design supports that conclusion.
5. Comparative Statistical Analysis
- Comparative statistical analysis is used to compare groups.
- This method is common in comparative research, quasi-experimental research, and experimental research design.
- It helps the researcher know whether two or more groups are different.
- For example, a researcher may compare test score results between students who learned online and students who learned in person.
- The goal is to see whether the difference between groups is statistically meaningful.
- Comparative analysis can involve independent and dependent variables.
- The independent variable may be the group or treatment type.
- The dependent variable may be the measured result.
- For example, in a study comparing two teaching methods, the teaching method is the independent variable.
- The test score is the dependent variable.
- This structure is common in experimental research and quasi-experimental quantitative research.
- Common comparative tests include t-tests and ANOVA.
- A t-test is often used when comparing two groups.
- ANOVA is often used when comparing three or more groups.
- These tests help answer research questions about group differences.
- They are also useful when the researcher wants to test hypotheses.
6. Data Presentation Methods
- Presenting data clearly is part of good quantitative data analysis.
- Quantitative research findings are easier to understand when they are presented in tables, charts, and graphs.
- A table can show exact numbers.
- A bar chart can compare categories.
- A line graph can show changes over time.
- A pie chart can show proportions, although it should be used carefully.
- Good presentation helps readers understand the research findings.
- The researcher should not only present numbers.
- The researcher should explain what the numbers mean.
- For example, instead of only saying the mean score was 78, the researcher should explain whether that score shows improvement, decline, or difference.
- This makes the research paper clearer and more useful.
- The data analysis should answer the research question directly.
- Every table, chart, and statistical test should connect to the research problem.
- If the research question asks about correlation, the analysis should explain the relationship between variables.
- If the research question asks about group differences, the analysis should compare the groups.
- If the research question asks about cause and effect, the analysis should match the experimental design.
What Are the Advantages and Disadvantages of Quantitative Research?
- Quantitative research has many advantages, but it also has some limitations.
- Before choosing this type of research, the researcher should understand the pros and cons of quantitative research.
- Quantitative research is useful when the goal is to measure, compare, predict, or test hypotheses.
- However, it may not be the best choice when the researcher wants to understand deep personal experiences, meanings, or emotions.
- This is why researchers sometimes compare quantitative vs qualitative methods before choosing a methodology.
Advantages of Quantitative Research
- 1. Quantitative research produces clear numerical evidence.
- One major advantage of quantitative research is that it collects numerical data.
- This makes the findings easier to measure and compare.
- For example, a researcher can report that 80% of participants preferred one product.
- This is clearer than only saying that many people liked the product.
- Numerical evidence makes quantitative research useful in business, healthcare, education, and social science.
- 2. Quantitative research can study large groups.
- Quantitative research methods such as surveys can collect data from many participants.
- This makes it easier to identify patterns across a large population.
- For example, a market research company may survey thousands of customers about buying habits.
- A school may collect test score data from hundreds of students.
- Large samples can make research findings more useful if the sample is selected properly.
- 3. Quantitative research supports statistical analysis.
- Since quantitative research uses numerical data, the researcher can apply statistical analysis.
- Statistical tools help test hypotheses, measure correlation, compare groups, and predict outcomes.
- This makes quantitative research strong when the researcher needs evidence-based conclusions.
- Appropriate descriptive and inferential statistics can make the research findings more accurate and meaningful.
- 4. Quantitative research can test cause-and-effect relationships.
- Experimental research design allows the researcher to test whether one variable affects another.
- The researcher can manipulate one or more independent variables and measure the dependent variable.
- A control group can be used to compare results.
- This makes experimental research one of the strongest quantitative research design methods.
- It is especially useful in medicine, psychology, science, and education.
- 5. Quantitative research is structured and repeatable.
- Quantitative research follows a planned research process.
- The research design, data collection, and data analysis are usually clearly defined.
- This makes it easier for another researcher to repeat the study.
- Repeatability supports reliability and validity.
- This is one reason quantitative research is widely used in academic and professional research.
- 6. Quantitative research helps with decision-making.
- Organisations often use quantitative research to make practical decisions.
- For example, a company may use customer survey data to improve services.
- A hospital may use patient outcome data to improve treatment.
- A school may use test score data to improve teaching methods.
- In this way, quantitative research can turn research data into useful action.
Disadvantages of Quantitative Research
- 1. Quantitative research may not explain deeper meanings.
- One of the main cons of quantitative research is that it focuses on numbers.
- It may show what is happening, but not always why it is happening.
- For example, quantitative research can show that 60% of employees are unhappy.
- However, qualitative research may be needed to understand the personal reasons behind their dissatisfaction.
- This is why qualitative methods are sometimes added to quantitative studies.
- 2. Quantitative research can miss human experiences.
- Qualitative research collects non-numerical data such as stories, feelings, and personal views.
- Quantitative research collects numbers, so it may not capture emotions or complex experiences well.
- For example, a pain scale can measure pain from 1 to 10, but it may not fully explain how pain affects a patient’s daily life.
- In such cases, qualitative and quantitative methods may work better together.
- 3. Poorly designed tools can weaken the findings.
- A quantitative research study depends heavily on the quality of the research method.
- If survey questions are biased, unclear, or too limited, the data may be weak.
- If the sample is too small or not suitable, the findings may not represent the population.
- If the study design does not align with the research question, the results may be misleading.
- This is why careful planning is needed before data collection starts.
- 4. Quantitative research may require statistical knowledge.
- Quantitative data analysis can be difficult for beginners.
- The researcher must choose the correct statistical test.
- Using the wrong analysis method can lead to incorrect conclusions.
- For example, correlation analysis should not be used to claim causation.
- The researcher must understand the limits of each statistical method.
- 5. Quantitative research can be expensive or time-consuming.
- Some types of quantitative research design require many participants, tools, tests, or controlled settings.
- Experimental research may require a control group, trained staff, equipment, and long follow-up periods.
- Large-scale survey research may also require money and time.
- This can make some quantitative research methods difficult for small projects.
- 6. Quantitative research may create a false sense of certainty.
- Numbers can look very convincing.
- However, numerical data can still be affected by bias, poor sampling, weak methodology, or measurement errors.
- A statistical result does not automatically mean the study is perfect.
- The researcher must still explain the limitations clearly.
- Strong quantitative research requires careful design, honest interpretation, and clear reporting.
- Overall, quantitative research is valuable when used correctly.
- It is best for measuring patterns, testing hypotheses, comparing groups, and analysing relationships between variables.
- It is also useful when the researcher needs numerical data to answer research questions.
- However, quantitative research should not be used only because it looks scientific.
- The research design should always match the research problem.
- When the research question needs both numbers and personal meaning, quantitative and qualitative methods may be combined.
- This helps create a stronger and more complete research study.
References
- Types of Quantitative Research Design – Grand Canyon University – https://www.gcu.edu/blog/doctoral-journey/types-of-quantitative-research-design
- Quantitative Research Methods – Kean University Library – https://libguides.kean.edu/c.php?g=1252755&p=9181554
- Quantitative Research – Gateway Community College Library – https://libguides.gatewaycc.edu/quantitative
- Qualitative vs. Quantitative Study – National University – https://www.nu.edu/blog/qualitative-vs-quantitative-study/