Overview of the BCG Matrix
- The BCG Matrix, also known as the Boston Consulting Group Growth-Share Matrix, is a tool used by businesses to evaluate the relative market share and market growth rate of their product lines or services.
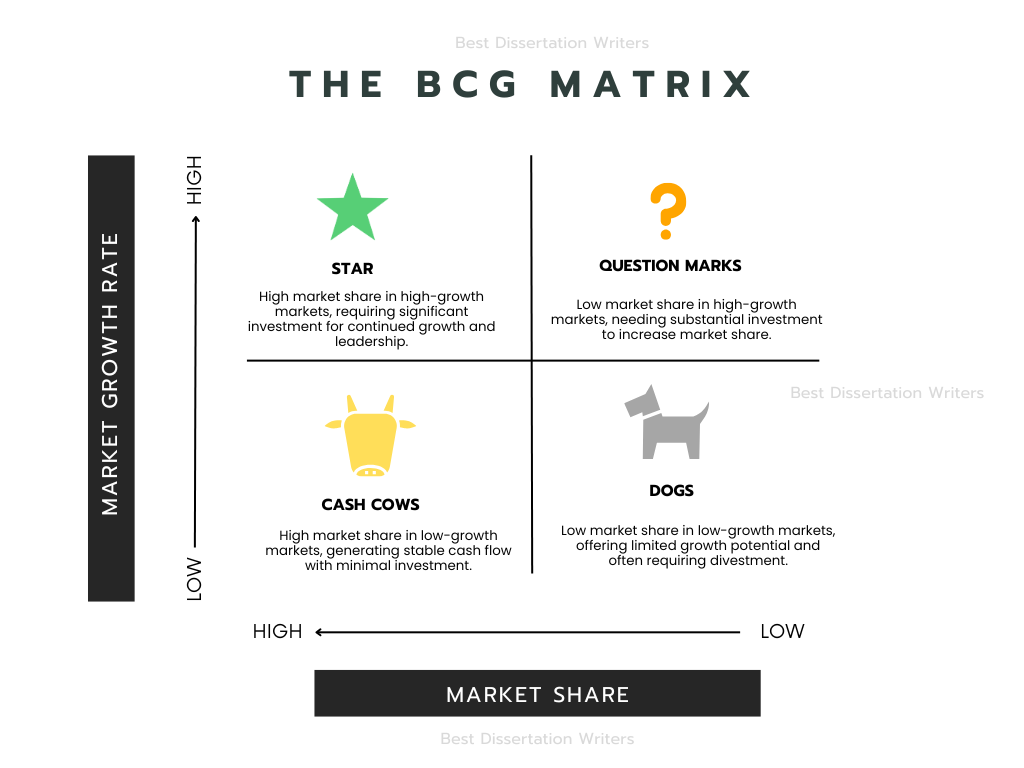
- The BCG Matrix classifies products into four categories: Stars, Cash Cows, Question Marks, and Dogs based on market share and growth rate.
What is the BCG Matrix?
- The BCG Matrix is a strategic business tool designed to help companies assess the performance and potential of different products or services.
- It uses two key factors: relative market share and market growth rate to categorize products or services.
- The market share is a measure of a product’s or service’s sales in relation to competitors. Market growth refers to the rate at which the market for the product or service is expanding.
- By analyzing these two factors, the BCG Matrix provides insights into the product’s or service’s future growth potential and required investment.
- The four categories in the BCG Matrix include Stars, Cash Cows, Question Marks, and Dogs.
Achieve Academic Excellence with Expert Help!
Struggling with your dissertation or essay? Let Best Dissertation Writers create a high-quality, custom paper tailored to your needs. Contact us today for professional, reliable, and timely writing assistance!
History and Development by the Boston Consulting Group
- The BCG Matrix was developed by the Boston Consulting Group (BCG) in the early 1970s to assist businesses in managing their portfolios of products and services.
- The Growth-Share Matrix was designed to provide a clear visual representation of a company’s products based on market share and market growth rate.
- It helped organizations prioritize investments in products that could potentially generate the most significant returns and growth opportunities.
- Initially, the BCG Matrix was used by large corporations, but over time, it has been widely adopted across different industries, offering valuable insights into a company’s business strategy.
Importance of the Growth Share Matrix in Strategic Planning
- The BCG Matrix plays a critical role in strategic planning by enabling businesses to assess which products or services deserve more focus and investment.
- Products in the Stars category (high market share, high growth) require heavy investment to maintain their leading position and support their growth.
- Cash Cows, with high market share but low growth, generate steady cash flow that can be used to fund other products or services, potentially driving further growth in other areas.
- Question Marks are products with low market share but high growth potential. These products may need strategic investments to move into the Stars category, or they may eventually become Dogs if they fail to gain traction.
- Dogs are products with low market share and low growth. These products may drain resources without offering substantial returns and could be candidates for divestiture or discontinuation.
- The BCG Matrix helps businesses identify growth opportunities by focusing on products with high growth rates and market share. It also aids in making decisions about product line expansion, investment, and divestment.
- Overall, the BCG Matrix provides a clear framework for evaluating market share and growth, allowing organizations to implement a well-rounded business strategy. It’s especially beneficial when companies need to make decisions about how to allocate resources effectively across their product lines and ensure profitability in various market conditions.
Components of the BCG Growth Share Matrix
- The BCG Matrix, also known as the Boston Consulting Group Matrix, is a strategic framework used to evaluate a company’s product portfolio based on relative market share and growth.
- The matrix categorizes products into four quadrants based on their market growth rate and relative market share, each representing different types of products with unique strategic implications.
- The four quadrants of the BCG Matrix include Stars, Cash Cows, Question Marks, and Dogs, each of which requires different strategic decisions for the company.
Understanding the Four Quadrants
- The BCG Matrix is divided into four quadrants: Stars, Cash Cows, Question Marks, and Dogs.
- Stars: High market share and high growth rate. These products are in a high-growth market and are market leaders. They require significant investment to maintain their position and grow market share.
- Cash Cows: High market share but low growth rate. These products are in mature markets and generate large cash flows for the company. Cash cows should be milked to fund other products or divisions.
- Question Marks: Low market share but high growth rate. These products have potential but require significant investment to increase their market share. Question marks must be analyzed carefully to determine if they can be nurtured into Stars.
- Dogs: Low market share and low growth rate. These products are in declining industries and may require strategic management to decide whether to divest or discontinue them.
Cash Cows: Characteristics and Examples
- Cash Cows are products or services with a high relative market share in a slow-growing industry.
- They generate large cash flows for the company with minimal investment, making them the backbone of the business.
- Cash Cows should be milked for all possible revenue while investing little in new development or marketing activities.
- The BCG Matrix suggests that businesses focus on maintaining their market share and product line to continue generating cash for the company.
- Over time, Stars may become Cash Cows as their market growth slows, and their position stabilizes in the market.
- Example: A dominant brand in a mature product category, like Coca-Cola in the soft drink industry.
Question Marks: Identifying Potential Opportunities
- Question Marks are products with low relative market share in a high-growth industry.
- They represent growth opportunities, but their success is uncertain, requiring careful evaluation to determine whether they should be invested in to increase market share.
- These products often require substantial resources and marketing activities to grow market share and compete with market leaders.
- Question marks must be analyzed to understand if they have the potential to become Stars or if they should be phased out.
- In strategic decision-making, the company needs to assess the cost of growth and whether the product can be successful in the long term.
- Example: A new tech gadget entering the market with potential but facing strong competition from established companies.
The BCG Matrix provides valuable insights into the strategic decisions that a business must make based on its product portfolio’s position in terms of market share and growth rate. The growth matrix helps companies decide where to invest, what to develop, and which products to potentially divest or discontinue. Understanding the BCG Matrix and its four categories is crucial in aligning a business’s strategic framework to maximize profitability and long-term success.
How to Use the BCG Matrix Effectively
- The BCG Matrix is a powerful tool for evaluating a company’s product portfolio based on market share and growth. It helps businesses make informed decisions about resource allocation, investments, and strategic management. Understanding how to use the BCG Matrix effectively is key to maximizing its potential.
Steps to Analyze Your Product Portfolio
- Step 1: Assess Market Growth and Relative Market Share
- To use the matrix, you first need to evaluate each product in your portfolio based on its market growth rate and relative market share.
- High market growth indicates a dynamic market, while relative market share helps assess a product’s competitive position in that market.
- Products with low share in a high-growth market are typically classified as Question Marks, while products with high share in such markets are considered Stars.
- Step 2: Categorize Products into the Four Quadrants
- After assessing each product, place them in one of the matrix categories: Stars, Cash Cows, Question Marks, or Dogs.
- Stars represent high-growth markets and high market share products. They need significant investment to maintain their growth.
- Cash Cows are products with high market share but low growth. These products generate stable cash flow with minimal investment.
- Question Marks require careful analysis. They have low market share in high-growth industries, meaning they need investment to grow or may be phased out.
- Dogs are products with both low market share and low growth, which may need to be eliminated from the portfolio when market growth declines.
- Step 3: Align Strategy Based on Matrix Insights
- Once categorized, the BCG Matrix allows for targeted strategic management decisions. For instance, Cash Cows should be leveraged to generate cash for the company, while Stars need continuous support to maintain their market position.
- Question Marks should be analyzed for growth potential. If they can be moved to Stars, significant resources should be allocated to them. If not, they should be cut or sold off.
Resource Allocation Based on Matrix Insights
- The insights from the BCG Matrix help determine where to allocate resources most effectively:
- Stars require ongoing investment to sustain their leadership, which means a substantial portion of the budget should be devoted to them.
- Cash Cows provide the necessary cash for the company, which can be used to fund the growth of Stars or turn Question Marks into Stars.
- Question Marks may need a heavy marketing investment to gain market share in a high-growth market and potentially evolve into Stars.
- Dogs, when market growth declines, should be gradually phased out unless they have niche value.
Common Mistakes in Using the BCG Matrix
- Mistake 1: Overemphasis on Market Share Alone
- While market share is important, the BCG Matrix should also consider industry growth. A low share in a high-growth market doesn’t always mean a product is doomed. It could be a growth opportunity if nurtured properly.
- Mistake 2: Neglecting the Long-Term View
- Stars can eventually become Cash Cows once their growth declines, and some Question Marks may never develop into successful products. A strategic decision based only on short-term growth can lead to missed opportunities.
- Mistake 3: Misinterpreting the Matrix
- The BCG Matrix doesn’t offer a one-size-fits-all solution. Each product should be evaluated based on its unique market growth rate and relative market share, rather than assuming it fits neatly into a category.
By understanding how the BCG Matrix works and using it effectively, businesses can make informed strategic decisions to optimize their product portfolio, maximize returns, and align resources with the most promising opportunities.
Real-World Examples of the BCG Matrix
- The BCG Matrix is widely used by companies to analyze their product portfolio and align their strategic decisions based on market share and growth. Here are some real-world examples that showcase the successful application of the BCG Matrix.
Case Study: Successful Application of the BCG Matrix
- Apple is an example of a company that effectively uses the BCG Matrix to manage its diverse product portfolio.
- Stars: Apple’s iPhone is a Star in the BCG Matrix due to its high market share and position in a high-growth market. Continuous innovation and significant investment have kept the iPhone a leader in the smartphone industry.
- Cash Cows: The iPad is a Cash Cow. It has high market share but is in a more mature market, generating steady revenue with less need for new investments.
- Question Marks: The Apple Watch started as a Question Mark. Initially, it had low market share in a growing wearable technology market, requiring careful evaluation and investment to increase its market share.
- Dogs: Some of Apple’s older products, such as the iPod, have entered the Dogs category. Their market growth has declined, and they are no longer a focus of investment.
Boost Your Grades with Professional Writing Services!
Get expert help with your dissertation or essay from Best Dissertation Writers. Our team ensures top-quality, plagiarism-free content delivered on time. Reach out today for a hassle-free, high-impact academic paper!
Example of a BCG Growth Strategy in Action
- Coca-Cola uses the BCG Matrix to assess its products and decide where to allocate resources.
- Stars: Coca-Cola’s Core Soft Drinks are in high-growth markets in various countries, allowing the brand to keep expanding its market share and reinvest heavily into the product.
- Cash Cows: Coca-Cola’s Diet Coke has become a Cash Cow, with a steady customer base in a mature market. It generates cash flow that supports the development of newer products.
- Question Marks: Newer products like Coca-Cola Energy started as Question Marks, as they had low market share but were entering a high-growth market in the energy drink sector.
- Dogs: Older flavors or underperforming products, such as certain Diet Coke variations, may be considered Dogs, where market growth has declined.
Lessons Learned from BCG Matrix Implementation
- The BCG Matrix provides valuable insights into growth and relative market share, but it also presents lessons for companies in how they handle their product portfolio:
- Market Leaders: Companies must carefully nurture their Stars because these are products with the most potential for growth but also the highest resource requirements. The BCG Matrix encourages companies to continue investing in Stars until they become cash cows.
- Growth Strategies for Question Marks: Question Marks require thorough analysis. If they show potential to grow into Stars, resources must be allocated. However, if they show signs of failing, they may need to be discarded or sold, especially if they are not likely to grow market share.
- Strategic Focus for Cash Cows: Businesses must use the matrix to recognize when products have matured. These Cash Cows should be “milked” to provide funds for new innovations or ventures.
- Dogs and Declining Markets: Dogs are products where market growth declines. The BCG Matrix helps companies identify when to stop investing in products that have no potential for growth. Decisive action needs to be taken, such as discontinuing products or selling off underperforming units.
By effectively applying the BCG Matrix, companies can align their resources and efforts with their most profitable and promising products. It is a proven growth share matrix that aids in balancing investment, product development, and strategic planning. Understanding how the BCG Matrix works can drive strategic decision-making and help companies achieve long-term success in dynamic markets.