What is Explanatory Sequential Design in Mixed Method Research?
- Explanatory sequential design is a two-phase design used in mixed methods research.
It begins with the collection and analysis of quantitative data, followed by qualitative data collection and analysis. The main purpose is to use qualitative data to explain, clarify, or expand the quantitative results. In simple terms, researchers first ask, “What is happening?” through numbers, and then ask, “Why is it happening?” through interviews, open-ended responses, focus groups, or observations. - The word “explanatory” shows the main purpose of the design.
Explanatory sequential design is used when the researcher wants an explanation behind statistical patterns, scores, differences, trends, or unexpected quantitative results. For example, a survey may show that students have low satisfaction with online learning. However, the numbers alone may not explain why students feel that way. The qualitative research phase can then explore students’ experiences in more depth. - The word “sequential” means the phases happen in order.
In explanatory sequential design, the quantitative strand comes first. After the quantitative data have been collected and analyzed, the researcher uses the initial results to guide the second phase. This makes the design different from convergent design, where quantitative and qualitative data are collected during the same general period and then compared. - Explanatory sequential design is useful when quantitative results need deeper meaning.
Quantitative data can show patterns clearly, but it may not always provide enough insight into the human experiences behind those patterns. For example, test scores can show that one group performed better than another, but they may not explain whether teaching style, motivation, access to resources, or confidence influenced the difference. - This research design connects numerical trends with personal experiences.
In mixed methods research, one major strength is the ability to combine quantitative and qualitative data. Explanatory sequential design does this in a structured way. First, the researcher identifies a pattern using numbers. Then, the researcher uses qualitative data to explain the pattern in more detail. - Explanatory sequential design is different from exploratory sequential design.
In exploratory sequential design, the researcher begins with qualitative data and then uses the findings to build or test something quantitatively. In explanatory sequential design, the process is reversed. The researcher begins with quantitative data collection and then follows with qualitative data collection to understand the meaning of the quantitative results. - It is also different from convergent design.
In a convergent design, the researcher collects qualitative and quantitative data separately but during a similar timeframe. After collection and analysis, the two sets of results are compared or merged. In explanatory sequential design, the researcher does not treat both strands as equal at the beginning. The quantitative strand usually leads the study, and the qualitative strand provides explanation. - Creswell describes this design as one of the major mixed-methods approaches.
In many mixed methods research texts, including work associated with Creswell and Sage Publications, explanatory sequential design is presented as a practical approach for studies where the researcher needs to explain statistical findings using human voices and lived experiences. - A simple example can make the design clearer.
A researcher may survey 300 nurses about workplace burnout. The quantitative results may show that younger nurses report higher burnout than older nurses. The researcher may then interview a smaller group of younger nurses to understand why this is happening. The interviews may reveal issues such as lack of mentorship, heavy workload, emotional stress, or limited confidence in clinical decision-making. - The final outcome is a richer explanation.
Instead of only saying, “Younger nurses had higher burnout scores,” explanatory sequential design allows the researcher to explain the reasons behind the result. This makes the findings more useful for decision-making, policy, education, healthcare, business, and social research.
Need Help With Your Dissertation?
Get professional academic support from Best Dissertation Writers . Our expert team is ready to help you with high-quality dissertation writing services tailored to your academic goals.
Get Dissertation HelpPhilosophical Assumptions of The Explanatory Sequential Design
- Explanatory sequential design is often connected to pragmatism.
Pragmatism is a philosophical approach that focuses on what works best for answering the research question. In mixed methods research, pragmatism supports the use of both qualitative and quantitative methods when one type of data is not enough. This fits explanatory sequential design because the researcher uses quantitative data first and then qualitative data to explain the results. - The design assumes that reality can be measured and interpreted.
The quantitative phase assumes that some parts of reality can be measured using surveys, tests, scales, experiments, or statistical tools. For example, researchers can measure satisfaction, performance, stress, knowledge, or attitudes. However, explanatory sequential design also assumes that numbers do not tell the full story. People’s views, experiences, and meanings are also important. - It accepts both objective and subjective knowledge.
Quantitative data often focus on objective measurement. Qualitative data focus more on subjective meaning. In explanatory sequential design, both forms of knowledge are valuable. The quantitative strand provides broad patterns, while the qualitative strand provides depth and personal explanation. - The design assumes that data can build on each other.
A key philosophical assumption is that one type of data can help improve the meaning of another type of data. In this case, qualitative data are used as data to explain the quantitative results. This makes the study more connected because the second phase is not separate from the first phase. It is directly shaped by the initial results. - Explanatory sequential design values context.
Quantitative results may show what is common across a large group, but qualitative research helps explain how context influences those results. For example, a workplace survey may show low employee engagement. Interviews may reveal that leadership style, communication gaps, or lack of career growth are affecting employees. Without the qualitative phase, the explanation may remain incomplete. - The design supports the idea that complex problems need more than one method.
Many research problems are too complex for one method alone. In education, healthcare, business, psychology, and social science, researchers often need both numbers and stories. Explanatory sequential design works well because it allows the researcher to start with measurable evidence and then move toward deeper explanation. - It assumes that the researcher plays an active role in connecting the two phases.
The researcher must decide which quantitative results need further explanation. This means the researcher does not simply collect two types of data randomly. Instead, the researcher carefully links the quantitative and qualitative phases. This connection is one of the most important parts of explanatory sequential design. - The design also assumes that integration is necessary.
In mixed-methods research, it is not enough to collect qualitative and quantitative data separately. The researcher must integrate the findings. In explanatory sequential design, integration usually happens when the qualitative findings are used to explain, support, question, or expand the quantitative results. - It supports practical problem-solving.
Because explanatory sequential design is often linked to pragmatic thinking, it is useful for real-world decision-making. Researchers can use it to understand why a programme worked, why a policy failed, why participants responded in a certain way, or why a statistical difference appeared between groups. - Sage and Sage Publications texts often present this design as useful for applied research.
This is because explanatory sequential design helps researchers move from general patterns to specific insight. It is especially helpful when the goal is not only to report results but also to improve practice, services, teaching, leadership, or policy.
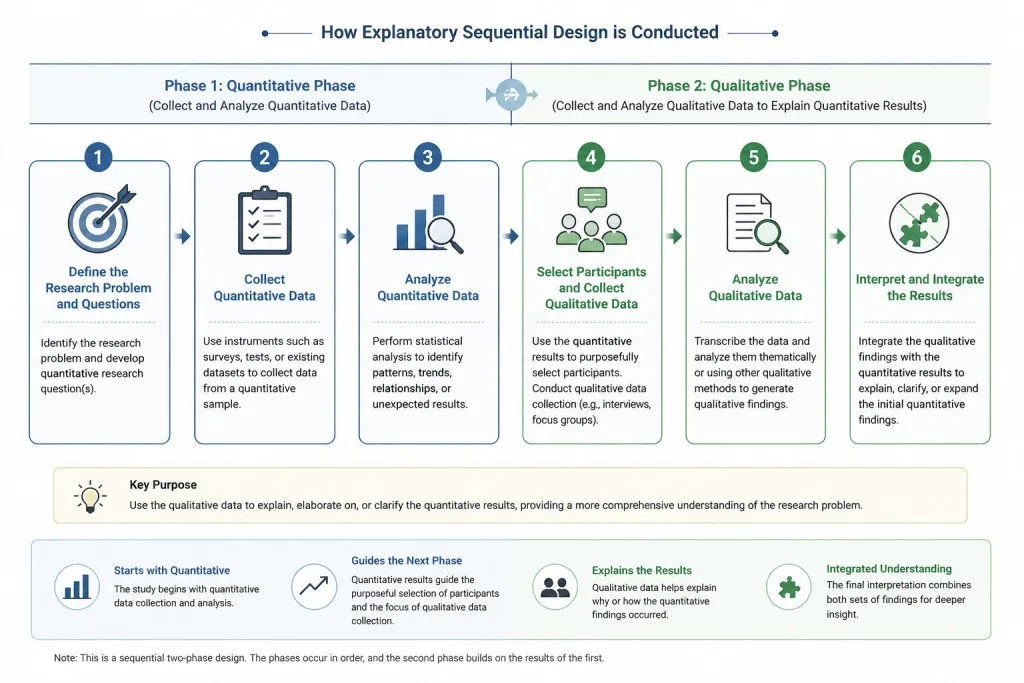
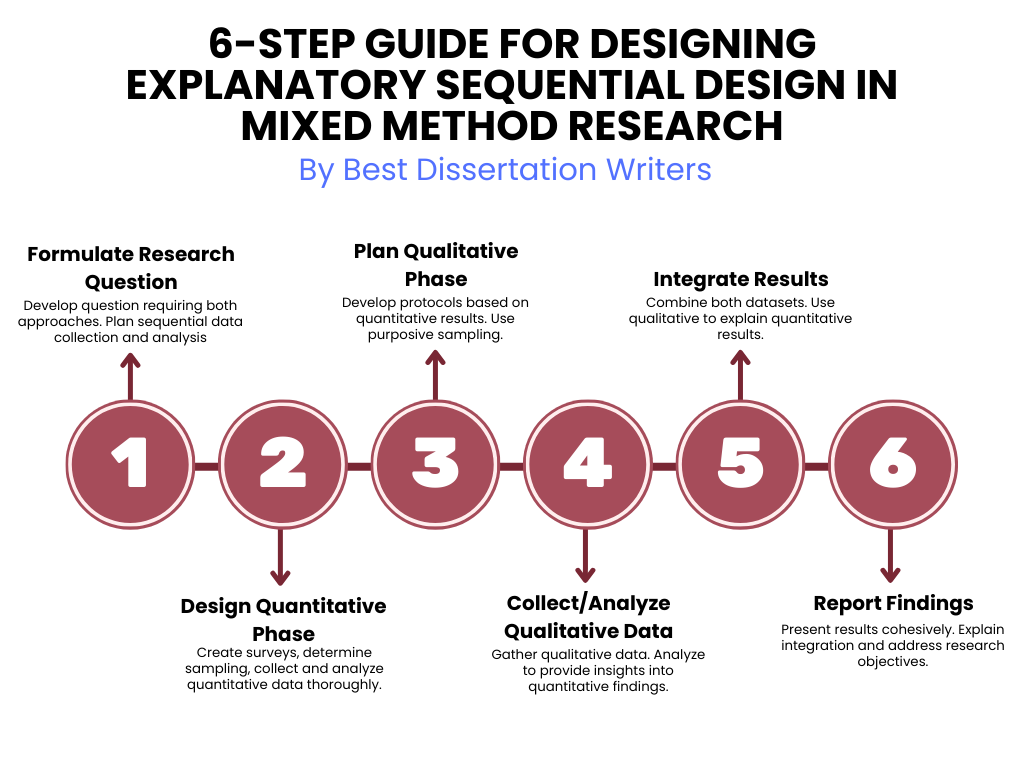
How To Conduct an Explanatory Sequential Design In 6 Easy Steps?
Step 1: Define the research problem and choose the reason for using explanatory sequential design.
- The first step is to identify a research problem that needs both quantitative and qualitative explanation. The researcher should ask whether numbers alone will be enough. If the expected results may need deeper explanation, explanatory sequential design may be the right research design. For example, if a researcher wants to know whether a training programme improved employee performance and why some employees improved more than others, this design is suitable.
Step 2: Develop clear research questions for both phases.
- The quantitative phase should focus on measurement. It may ask questions such as, “What is the level of student engagement?” or “Is there a relationship between workload and job satisfaction?” The qualitative phase should focus on explanation. It may ask, “Why did participants report low engagement?” or “How do employees describe the causes of low job satisfaction?” In explanatory sequential design, the qualitative questions often become clearer after the quantitative results are available.
Step 3: Conduct quantitative data collection first.
- The researcher begins by collecting quantitative data. This may involve surveys, questionnaires, test scores, performance records, experiments, or structured assessments. This stage is important because the first phase creates the foundation for the rest of the study. The researcher must choose a sample size that is suitable for the quantitative strand and ensure that the data collection tools match the research objectives.
Step 4: Analyze the quantitative data and identify initial results.
- After the quantitative data collection stage, the researcher conducts data analysis. This may include descriptive statistics, correlations, comparisons, regression analysis, or other statistical methods. The goal is to identify the main quantitative results. These results may include expected findings, surprising findings, strong trends, weak relationships, or differences between groups. In explanatory sequential design, these initial results guide the next stage of the study.
Step 5: Use the quantitative results to plan qualitative data collection.
- This is where explanatory sequential design becomes clearly connected. The researcher selects specific quantitative results that need further explanation. For example, if survey results show that one group has much lower satisfaction than another group, the researcher may choose participants from that group for interviews. The qualitative data collection may include interviews, focus groups, open-ended questions, reflective journals, or observations. The aim is to collect qualitative data that explains the numbers.
Step 6: Analyze, integrate, and explain the findings.
- Once qualitative data have been collected and analyzed, the researcher connects the findings from both phases. The qualitative findings should help explain the quantitative results. For example, if quantitative results show low motivation among first-year students, interview data may reveal that students feel isolated, confused by course expectations, or unsupported by tutors. The final report should show how the qualitative findings provide explanation and insight into the statistical results.
- A good explanatory sequential design must show a clear link between the two phases.
The second phase should not feel separate or random. It should clearly grow out of the first phase. Readers should be able to see how the quantitative results shaped the qualitative questions, participant selection, and interpretation. This is what makes explanatory sequential design strong and logical. - The researcher should decide how much weight each phase will receive.
In many studies, the quantitative phase has greater weight because it comes first and guides the study. However, the qualitative phase is still essential because it provides the explanation. In some studies, both phases may be treated as equally important. The decision depends on the research purpose. - Sampling must be planned carefully.
In the quantitative phase, the researcher may use a larger sample to identify patterns. In the qualitative phase, the researcher usually uses a smaller sample to explore experiences in depth. For example, a survey may include 500 participants, while interviews may include 15 to 25 participants selected because their responses help explain important quantitative results. - The timing of collection and analysis should be clearly stated.
Because explanatory sequential design is a sequential two-phase design, the researcher must explain when each phase happened. The quantitative data are collected and analyzed first. The qualitative data are then collected and analyzed second. This order should be clear in the methodology section. - The final write-up should present both strands in a connected way.
The researcher may first present the quantitative results, then the qualitative findings, and finally an integrated explanation. Another option is to organize the discussion around key themes and explain how the qualitative findings clarify the quantitative results. The main goal is to avoid presenting two disconnected studies. - Researchers should also explain why they did not use another mixed-methods design.
For example, they may explain that convergent design was not suitable because the qualitative phase needed to be based on the quantitative results. They may also explain that exploratory sequential design was not suitable because the study did not begin with open exploration. Instead, the researcher needed to measure a pattern first and then explain it. - The strongest studies use the second phase to create meaningful insight.
The qualitative phase should not simply repeat the numbers. It should add depth, detail, and human meaning. In explanatory sequential design, the goal is not only to confirm the quantitative results but also to understand the reasons behind them. - Overall, explanatory sequential design is one of the clearest mixed methods research approaches.
It is easy for readers to follow because it moves from numbers to explanation. It begins with quantitative data, continues with qualitative data, and ends with an integrated interpretation. When used well, explanatory sequential design helps researchers produce findings that are both measurable and meaningful.
Explanatory Sequential Design Process Table
The table below presents the main phases, procedures, and outcomes involved in conducting an explanatory sequential design.
| Phase | Procedure | Outcome |
|---|---|---|
| Quantitative Data Collection |
|
|
| Quantitative Data Analysis |
|
|
| Qualitative Data Collection |
|
|
| Qualitative Data Analysis |
|
|
| Integration of Quantitative and Qualitative Findings |
|
|
What are the Advantages and Disadvantages of Explanatory Sequential Design in Mixed Method Research?
Explanatory sequential design has important strengths and limitations. It is useful because it begins with quantitative findings and then uses qualitative data to explain, clarify, or expand those findings. However, because explanatory sequential design uses two connected phases, it also requires careful planning, enough time, and strong skills in both quantitative and qualitative research.
Advantages of Explanatory Sequential Design
- No. 1: It helps explain quantitative findings more clearly.
One major advantage of explanatory sequential design is that it helps researchers move beyond numbers. In the quantitative phase, the researcher may measure variables, test a hypothesis, or identify statistical relationships. However, the numbers may not fully explain why the results happened. The qualitative phase adds participants’ views, experiences, and explanations.
Example: A survey may show that students in online classes have low engagement. Follow-up qualitative interviews may reveal that students feel isolated, have poor internet access, or need more direct support from instructors. - No. 2: It is useful for explaining surprising or unclear results.
Explanatory sequential design is helpful when quantitative data analysis produces unexpected findings. Instead of guessing why the results occurred, the researcher can conduct a subsequent qualitative phase to explore the reasons. This makes the explanation stronger and more grounded in participants’ real experiences.
Example: A web-based employee survey may show that a training programme improved performance for senior staff but not for new staff. Semi-structured interviews may show that new staff needed more mentoring, practical examples, or extra time to apply the training. - No. 3: It provides deeper insights than one method alone.
Mixed methods research involves combining qualitative and quantitative data to answer a research question more fully. In explanatory sequential design, the quantitative phase gives broad statistical patterns, while the qualitative phase provides detailed explanations. This gives researchers a more comprehensive understanding of the topic.
Example: In health sciences research, a hospital may first use a patient satisfaction survey to measure service quality. After reviewing the scores, researchers may interview patients to understand what made them feel respected, ignored, supported, or dissatisfied. - No. 4: It allows purposeful selection of participants for the qualitative phase.
After the quantitative phase, the research team can use the initial results to guide selecting participants for the qualitative phase. This is often done through purposive sampling. Researchers may choose participants with high scores, low scores, unusual responses, or specific demographic characteristics that need further explanation.
Example: If a school survey shows that some students have very low confidence in mathematics, the researcher may select those students for interviews to understand their learning challenges. - No. 5: It creates a clear and logical research structure.
Explanatory sequential design is easy for readers to follow because it has a clear sequence. The study begins with quantitative data, followed by qualitative data. This makes the research design easier to explain in a methodology section because readers can see how the first phase leads to the second phase.
Example: A dissertation may first present survey results on student stress, then present interview themes explaining why students feel stressed, and finally integrate both findings in the discussion section.
Mixed Methods Research Design Guides
Structured guides to key mixed methods research designs including sequential, convergent, embedded, multiphase approaches, and dissertation methodology foundations.
Research Methodology in Dissertation
Core foundations of research design, structure, and methodology in dissertations. Read full guide →
Mixed Methods Overview
Foundations of qualitative and quantitative integration. Explore article →
Explanatory Sequential
Quantitative results followed by qualitative explanation. Read more →
Exploratory Sequential
Qualitative insights shaping quantitative instruments. Read more →
Convergent Parallel
Concurrent qualitative and quantitative analysis. Read more →
Embedded Design
One method embedded within another dominant design. Read more →
Transformative Design
Research focused on change and social impact. Read more →
Multiphase Design
Multiple linked phases across one research program. Read more →
Disadvantages of Explanatory Sequential Design
- No. 1: It can take more time to complete.
One major disadvantage of explanatory sequential design is that it has two separate phases. The researcher must first complete quantitative data collection and quantitative data analysis before beginning the qualitative phase. This can make the full study longer than a purely quantitative or purely qualitative study.
Example: A researcher studying employee engagement may need several weeks to collect survey responses, more time to analyse the data, and additional time to conduct and analyse interviews. - No. 2: It may require more research skills and support.
Explanatory sequential design often requires skills in both statistical analysis and qualitative data analysis. One researcher may be strong in quantitative research but less experienced with interviews, coding, or textual analysis. For this reason, a research team may need people with different skills.
Example: A health sciences study may need a statistician to analyse survey data and a qualitative researcher to conduct semi-structured interviews and identify themes. - No. 3: It can be difficult to implement without careful planning.
Explanatory sequential design must show a strong connection between the quantitative phase and the qualitative phase. If the researcher does not plan this connection clearly, the study may feel like two separate projects instead of one integrated mixed methods study.
Example: If a researcher conducts interviews that do not relate directly to the survey findings, the qualitative results may fail to explain the quantitative findings. - No. 4: Ethical approval can make the process more complex.
Many studies require approval from an institutional review board, also known as an IRB. In explanatory sequential design, the IRB may need to review both phases of the study. This is especially important when participants from the quantitative sample are contacted again for qualitative interviews.
Example: A researcher may need approval to collect survey data from students and then request additional consent before selecting some of those students for follow-up interviews. - No. 5: Integration of findings can be challenging.
Some researchers collect both quantitative and qualitative data but struggle to connect them clearly. In explanatory sequential design, the final report should not simply present two separate sets of results. It should show how the qualitative findings explain, support, expand, or challenge the quantitative findings.
Example: If a school study reports exam scores in one section and interview themes in another section without connecting them, the study may fail to show the real value of using mixed methods.
Overall, explanatory sequential design is valuable when researchers need qualitative data to explain quantitative findings. Its main strength is that it connects statistical patterns with human experiences. However, it must be planned carefully because it can take more time, require stronger research skills, and create challenges in ethical approval, participant selection, and integration.
Examples of Explanatory Sequential Design
Example 1: Student performance and online learning.
- A researcher may use explanatory sequential design to study student performance in online classes. First, the researcher collects quantitative data through grades, attendance records, and web-based survey responses. The quantitative findings may show that students who attend live sessions perform better than those who only watch recordings. This quantitative phase helps measure the relationship between attendance and performance.
- How the qualitative phase works in this example.
After the quantitative results are collected and analyzed, the researcher may conduct semi-structured interviews with selected students. The participants for the qualitative stage may include high-performing students and low-performing students. The qualitative interviews may reveal that live sessions help students ask questions, feel connected, and stay motivated. In this case, qualitative data to explain the quantitative results gives the study stronger meaning.
Example 2: Nurse burnout in health sciences.
- In health sciences, explanatory sequential design can be used to examine nurse burnout. The quantitative phase may involve a survey measuring stress, workload, job satisfaction, and burnout levels. The quantitative data analysis may show that nurses working night shifts have higher burnout scores than nurses working day shifts.
- How qualitative results add explanation.
The researcher may then implement a followed by a qualitative phase using interviews with night-shift nurses. These interviews may show that burnout is linked to poor sleep, fewer managers on duty, family responsibilities, and limited emotional support. The qualitative findings help explain quantitative results by showing the lived experiences behind the statistical pattern.
Need Help With Your Dissertation?
Get professional academic support from Best Dissertation Writers . Our expert team is ready to help you with high-quality dissertation writing services tailored to your academic goals.
Get Dissertation HelpExample 3: Employee engagement in an organisation.
- A company may use explanatory sequential mixed methods to understand employee engagement. First, a quantitative sample of employees completes a survey measuring motivation, leadership trust, career growth, and workplace satisfaction. The quantitative findings may show that younger employees report lower engagement than older employees.
- How the explanatory design improves decision-making.
The research team may then use purposive sampling to select younger employees for qualitative interviews. During qualitative data collection and analysis, employees may explain that they feel ignored in promotion decisions, lack mentorship, and want clearer career pathways. This helps the organisation refine its human resource strategy using both qualitative and quantitative data.
Example 4: Public health campaign evaluation.
- Explanatory sequential design may be used to evaluate a public health campaign. The quantitative phase may measure awareness before and after the campaign. The statistical results may show that awareness improved overall, but some demographic characteristics, such as age or education level, influenced the results.
- How qualitative data can explain the quantitative difference.
The subsequent qualitative phase may involve focus groups with people from different demographic groups. Their responses may show that some people found the campaign language too technical, while others preferred visual or textual messages in local languages. The qualitative strand helps explain why the campaign worked better for some groups than others.
Example 5: Customer satisfaction in a digital service.
- A business may use explanatory sequential design to study customer satisfaction with an app or website. First, quantitative research may measure user ratings, completion rates, complaint numbers, and repeat usage. The quantitative findings may show that customers abandon the service at one specific step.
- How interviews provide deeper insight.
The researcher may then conduct qualitative interviews with customers who abandoned the process. The qualitative results may show that the page was confusing, the instructions were unclear, or the approval process felt too long. This gives the business practical data to explain the quantitative results and improve the service. - Overall, explanatory sequential design works best when numbers need explanation.
It is especially useful when researchers want to explain unexpected results, compare groups, understand statistical patterns, or develop deeper insights from a quantitative study. When carefully planned, explanatory sequential design provides a comprehensive understanding by connecting measurement with meaning.
References
- Mixed Methods Designs – Georgia State University Library Research Guides – https://research.library.gsu.edu/c.php?g=1050115&p=7622501
- Qualitative Research: Mixed Methods Research – Gonzaga University Library – https://researchguides.gonzaga.edu/qualitative/mixed-methods
- Mixed Methods Analysis – Georgetown University Library – https://guides.library.georgetown.edu/c.php?g=1311988&p=9670809