Python for Data Analysis – Key Takeaways
- Python for data analysis has become one of the most valuable skills in modern analytics.
- Whether you are a beginner exploring your first dataset or an experienced data analyst trying to improve efficiency, Python offers a practical and flexible way to work with data.
- It helps professionals move from raw data to clear insights without relying only on spreadsheets or manual reporting.
- Because of its simplicity and wide adoption, many people now learn Python as part of their journey into data science, data analytics, and even machine learning.
- One reason Python for data analysis is so popular is that it balances power with readability.
- The syntax is easier to follow than many other programming language options, which makes it friendly for people with limited programming knowledge.
- At the same time, it is powerful enough for complex tasks such as statistical analysis, regression, automation, and building predictive models.
- This makes it useful not only for a data analyst, but also for a data scientist, business teams, and technical professionals working around data.
- Another major advantage is the ecosystem.
- Python gives you access to a rich set of python libraries that simplify everyday work.
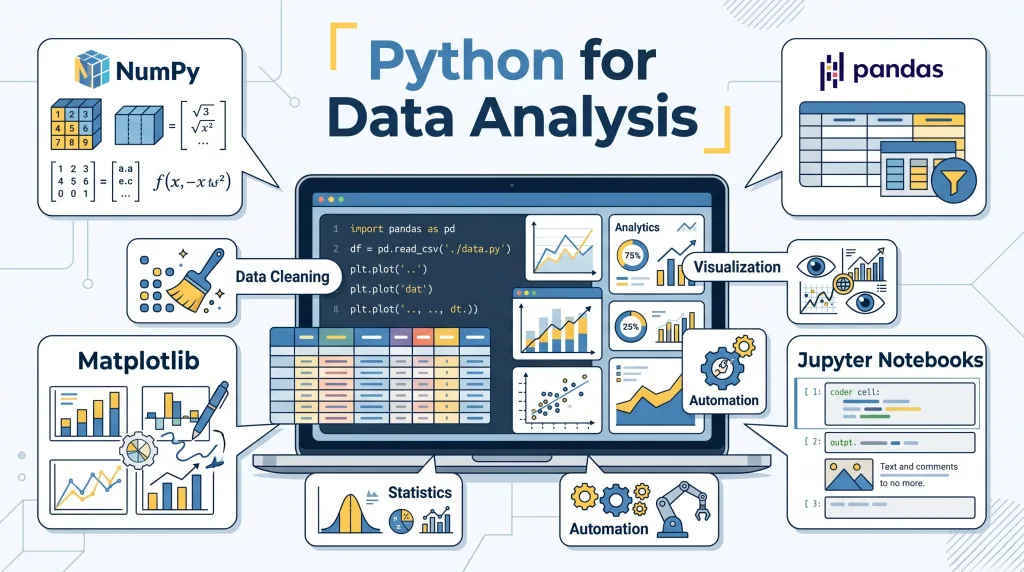
- With tools like numpy, pandas, matplotlib, scipy, and scikit-learn, you can clean data, explore patterns, perform inferential and descriptive analysis, and visualize data clearly.
- Instead of switching between multiple disconnected tools, you can use python to manage a complete workflow in one place.
What Is Python for Data Analysis?
- Python for data analysis means using the Python programming language to collect, clean, explore, analyze, and present data.
- In simple terms, it is the process of using code to understand what a dataset contains and what story it tells.
- This can involve identifying trends, comparing groups, measuring performance, spotting anomalies, and supporting better decisions.
- It is often used in business intelligence, research, operations, finance, marketing, and data science.
- This is an important example of data analysis tools that are widely used in the visualization and interpretation of real-world business.
- Data analysis with python usually starts with a question.
- A company may want to know why sales dropped.
- A marketing team may want to see which campaign performed best.
- A product team may want to understand user behavior.
- In all of these use cases, Python for data analysis helps turn raw data into meaningful answers.
- The process is broader than just calculations.
- It includes importing files, organizing messy information, checking data quality, running statistical analysis, and communicating findings.
- A strong analysis is not only about numbers but also about context, logic, and clarity.
- That is why Python for data analysis is important for both technical and non-technical business environments.
- It also connects closely to data science and machine learning.
- In many workflows, data analysis with python comes before advanced modeling.
- A data scientist may first inspect the dataset, clean missing values, and study patterns before building a machine learning model.
- Without solid analysis first, later results may be weak or misleading.
- Compared with using r or spreadsheet-only workflows, Python has a broader general-purpose advantage.
- Some professionals still prefer using r for very specific statistical tasks, but Python offers a more versatile environment for analysis, automation, application building, and integration.
- It also works well alongside sql, which is commonly used to extract data from databases before analysis begins.
- For many modern teams, knowing how to use python and SQL together is a highly valuable combination.
Why Should Every Data Analyst Learn Python?
- Every data analyst should learn Python because it improves speed and efficiency.
- Manual work in spreadsheets becomes difficult when data grows larger or more complex.
- Python can automate repetitive tasks such as cleaning columns, combining files, filtering records, and generating reports.
- This saves time and reduces human error.
- Python for data analysis also helps analysts work with larger and messier datasets.
- Real-world data is often incomplete, inconsistent, and spread across multiple sources.
- A data analyst who can use python can handle large volumes of raw data more effectively than someone limited to manual tools.
- This is especially important in modern data analytics environments where information updates quickly.
- It strengthens analytical thinking.
- When you learn data analysis with python, you are not only learning code.
- You are learning how to structure a problem, test assumptions, inspect results, and think logically.
- Those habits improve the quality of your analytics work overall.
- It expands career opportunities.
- Employers increasingly expect analysts to know python, sql, and BI tools.
- Even if a role is not fully technical, Python for data analysis is often seen as a major advantage.
- It can help a data analyst move into more advanced roles such as analytics specialist, data scientist, or machine learning practitioner.
- It supports advanced analysis.
- Python makes it easier to run statistical analysis, including summary metrics, correlations, hypothesis tests, inferential methods, and regression models.
- With the right python libraries, these tasks become much more manageable.
- This means analysts can go beyond dashboards and deliver deeper insight.
- It helps you communicate data better.
- Good analysis is not only about finding answers but also about presenting them clearly.
- Python tools allow you to visualize data through charts, graphs, and trend lines that are easier for stakeholders to understand.
- That makes your work more useful across teams.
Which Python Tools Are Essential for Data Analysis?
- Several tools form the core toolkit for Python for data analysis.
- Each tool has a specific role, and together they create a strong workflow for everyday analytics.
- Python itself
- The first essential tool is the language itself.
- Python programming is readable, widely supported, and suitable for beginners and professionals.
- If you want to know python well, you need to understand variables, loops, functions, data types, and basic file handling.
- Pandas
- Pandas is one of the most important tools in data analysis with python.
- It helps you load, filter, reshape, sort, merge, and summarize a dataset.
- Many everyday tasks in Python for data analysis happen inside pandas DataFrames.
- If you want to learn python for practical analysis, pandas is usually the first major library to master.
- NumPy
- NumPy is essential for numerical work.
- It supports efficient array operations and underpins many scientific tools in the Python ecosystem.
- It is especially useful when working with calculations, performance-heavy operations, and concepts linked to linear algebra.
- Matplotlib
- Matplotlib is widely used to create charts and graphs.
- It allows analysts to visualize data in the form of line charts, bar charts, scatter plots, histograms, and more.
- Strong visuals help explain patterns clearly to teams and decision-makers.
- SciPy
- SciPy is useful for scientific and statistical analysis.
- It includes functions for optimization, testing, distributions, and other more advanced analytical tasks.
- It becomes especially valuable when you move deeper into inferential methods.
- Scikit-learn
- Scikit-learn is a major library for machine learning.
- Although it is best known for predictive modeling, it is also useful for preprocessing, clustering, and regression tasks.
- Analysts who want to move toward data science often begin here after mastering basic Python for data analysis.
- Jupyter Notebook or another IDE
- A notebook environment or IDE helps you write and test code efficiently.
- Jupyter Notebook is popular because it combines code, output, and notes in one place.
- Other options, such as VS Code or PyCharm, are useful for larger projects and structured python programming.
How Do You Set Up Python for Data Analysis?
- Start by installing Python.
- Download the latest stable version from the official source.
- Make sure Python is correctly added to your system path during installation.
- Once installed, verify it works from the command line.
- Choose where you will write code.
- Beginners often prefer Jupyter Notebook because it is interactive and easy to follow.
- Others may prefer an IDE like VS Code for a more complete development experience.
- The right choice depends on your comfort level and workflow.
- Install the main python libraries.
- For most beginners, the core setup includes pandas, numpy, matplotlib, scipy, and scikit-learn.
- These libraries cover most early needs in Python for data analysis.
- A common setup can be done with package managers such as pip or Anaconda.
- Create a clean working environment.
- It is good practice to use virtual environments so that project dependencies stay organized.
- This prevents conflicts between projects and makes your setup more stable.
- Clean environments are especially important as your python programming becomes more advanced.
- Test your setup with a small example.
- Open your notebook or IDE.
- Import pandas and load a simple dataset.
- Run a few commands to confirm that everything works.
- This small step builds confidence before you move into deeper data analysis with python.
- Connect your workflow to real data sources.
- In practice, many analysts pull data from csv files, APIs, spreadsheets, or SQL databases.
- Setting up access to these sources early helps you work on realistic projects.
- That is one of the best ways to learn data analysis with python in a meaningful way.
Struggling with Your Data Analysis or Dissertation Statistics?
Get expert assistance with your data analysis projects or dissertation statistics from Best Dissertation Writers . Our team specializes in providing dissertation statistics help , ensuring accurate, well-analyzed results tailored to your research needs. Visit our site to get professional guidance and elevate the quality of your data-driven projects.
Get Professional HelpWhat Are the Core Steps in Data Analysis with Python?
- Step 1: Define the question
- Every project should begin with a clear goal.
- You need to know what business problem, research question, or performance issue you are trying to solve.
- Good analysis starts with focus.
- Step 2: Collect the data
- Gather the dataset from relevant sources such as csv files, databases, APIs, or internal systems.
- In many cases, analysts use sql to extract the right records before beginning Python for data analysis.
- The quality of your final result depends heavily on the quality of your input.
- Step 3: Clean the raw data
- Raw data often includes missing values, duplicate rows, inconsistent labels, and formatting errors.
- This stage may involve renaming columns, fixing types, removing outliers, and standardizing categories.
- Clean data is essential for trustworthy analytics.
- Step 4: Explore the dataset
- At this stage, you inspect distributions, summary statistics, and unusual patterns.
- You begin to understand relationships, changes over time, and possible limitations.
- This step is where many early insights appear.
- Step 5: Perform statistical analysis
- Depending on the goal, this may include averages, correlations, significance tests, inferential methods, or regression.
- These methods help move from observation to evidence.
- This is where Python for data analysis becomes especially powerful for decision-making.
- Step 6: Visualize data
- Charts make complex findings easier to understand.
- You might create trend lines, bar charts, scatter plots, or comparisons using matplotlib.
- The goal is not decoration but clarity.
- Step 7: Interpret and communicate results
- Good analysts explain what the output means in business terms.
- They connect results back to the original question and highlight action points.
- Strong communication turns technical work into practical value.
- Step 8: Apply findings
- The final step is using insight to support better choices.
- That may mean improving operations, adjusting strategy, guiding machine learning projects, or informing stakeholders.
- This is why Python for data analysis matters so much in real-world analytics.
How Do You Clean Data in Python?
- Data cleaning is one of the most important parts of Python for data analysis because even the best tools cannot fix poor-quality input on their own.
- In real projects, raw information rarely arrives in a perfect format.
- A data analyst often works with incomplete records, mixed formats, misspelled categories, duplicate entries, and values that do not make sense.
- That is why Python for data analysis begins with cleaning before deeper insights, reporting, or modeling can happen.
- In practice, good cleaning creates the foundation for trustworthy data analysis using python, better reporting, and stronger business decisions.
- The first step in cleaning is understanding what your data actually looks like.
- Before changing anything, it helps to inspect the structure of the file, check the number of rows and columns, and review data types.
- You may be working with spreadsheets, databases, APIs, or plain text files saved as csvs, and each source may have its own issues.
- Many analysts start by opening a few rows, checking column names, and identifying where the most obvious quality problems appear.
- This early review matters because Python for data analysis works best when you understand the shape of the problem before writing transformations.
- Missing values are one of the most common cleaning issues.
- Some rows may have empty fields because data was never collected, entered incorrectly, or lost in transfer.
- In some cases, missing values can be removed safely.
- In other situations, the better choice is to fill them with a median, average, placeholder, or business rule.
- The right method depends on context.
- For example, a missing customer age is different from a missing transaction amount, and a skilled data analyst with python knows that each case needs careful judgment.
- Duplicate records can quietly distort results if they are not removed.
- If the same customer, order, or event appears more than once, totals and trends may look inflated.
- A simple duplication problem can lead to inaccurate performance reporting and poor strategic decisions.
- Python for data analysis helps identify exact duplicates as well as near-duplicates that require closer review.
- This is especially useful when combining multiple files or importing repeated exports from different teams.
- Standardizing formats is another major cleaning task.
- Dates may appear in several styles.
- Country names may use different spellings.
- Product categories may include upper-case, lower-case, abbreviations, or typing mistakes.
- Good cleaning means turning inconsistent labels into one reliable format.
- This step improves the quality of different data analyses, especially when grouping, filtering, or comparing values later.
- You also need to correct data types before analysis begins.
- A number stored as text cannot be used properly in calculations.
- A date stored as a string will not sort or filter correctly by time.
- Python for data analysis makes it easier to convert columns into the correct types, which is essential for calculations, trend analysis, and forecasting.
- This matters across many data sets, especially when files come from manual exports or systems with inconsistent formatting rules.
- Outliers and invalid values should be checked carefully.
- Some unusual values are true business events and should stay.
- Others are simple errors, such as a negative quantity where negatives are impossible or an age of 500.
- The goal is not to remove every extreme value automatically.
- The goal is to decide whether the value is real, rare, or wrong.
- Good Python for data analysis supports that judgment by helping you inspect patterns before deleting information.
- Column naming and structure also matter more than many beginners expect.
- Clear, consistent column names make your workflow easier to read and maintain.
- Renaming vague headers and removing unnecessary spaces can save time later when building code, dashboards, or reports.
- Clean structure is especially helpful when sharing work through github, where teammates need to understand the logic quickly.
- A strong cleaning workflow is not only technical but also practical.
- It helps you trust your results.
- It reduces avoidable mistakes.
- It makes later analysis smoother.
- This is one reason Python for data analysis is widely used in business, research, scientific computing, and operations.
- When cleaning is done well, the rest of the project becomes faster, clearer, and more reliable.
How Do You Perform Exploratory Data Analysis with Python?
- Exploratory Data Analysis, often called EDA, is the stage where you start learning what the data is trying to tell you.
- After cleaning, you move from fixing problems to discovering patterns.
- This is where Python for data analysis becomes especially useful because it lets you inspect trends, distributions, relationships, and unusual behavior in a structured way.
- EDA is often the point where a rough dataset starts turning into a real story.
- The main goal of EDA is to understand the data before making strong conclusions.
- You are not trying to prove a final answer too early.
- Instead, you are exploring what is common, what is changing, what looks unusual, and what deserves deeper analysis.
- This makes Python for data analysis valuable not only for reports, but also for decision-making, experimentation, and product research.
- A good EDA process often begins with summary views.
- You look at counts, averages, minimums, maximums, and distributions.
- This helps you quickly understand scale, spread, and imbalance.
- A sales column may show an average that looks fine at first, but a deeper check may reveal that a few very large values are hiding weak performance elsewhere.
- These early views are essential in data analysis using python because they help you avoid shallow interpretations.
- Grouping data is one of the most powerful EDA techniques.
- Instead of looking only at totals, you break the data into categories such as region, product type, customer segment, or month.
- This often reveals patterns that disappear in the overall average.
- For example, one market may be growing while another is declining, even if the company total looks stable.
- That is why Python for data analysis is so useful for business work: it helps uncover detail that broad summaries can miss.
- Relationships between variables are another key focus.
- You may want to know whether price affects sales, whether engagement affects conversion, or whether time on site relates to retention.
- Exploratory work helps you identify possible links before moving into formal tests or predictive models.
- This stage is especially useful for people who later want to study machine learning, because strong exploration improves feature understanding and model quality.
- EDA also helps you identify segmentation opportunities.
- Customers, users, or products are rarely all the same.
- By examining clusters, categories, or ranges, you can find meaningful groups inside the dataset.
- These patterns may support targeting, reporting, or future experiments.
- In many organizations, this kind of insight is where Python for data analysis creates immediate practical value.
- Time-based exploration is often important as well.
- Looking at daily, weekly, or monthly changes can reveal cycles, growth, seasonality, or unusual events.
- A data analyst with python often uses this kind of exploration to explain business shifts and support forecasting decisions.
- Even simple time-based patterns can make analysis far more useful to stakeholders.
- EDA is not just about finding interesting charts.
- It is about building intuition.
- It helps you understand whether your assumptions make sense, whether the data is stable enough to trust, and which questions are worth asking next.
- That is why Python for data analysis remains central in both business analytics and research environments.
- This stage also highlights how Python compares with other ecosystems.
- Some teams still prefer r for data analysis or switch between python and r depending on the problem.
- There are strong reasons for both choices.
- Still, Python for data analysis is especially attractive because it connects exploration with automation, reporting, engineering, and production workflows more easily than many single-purpose tools.
- That flexibility matters when analysis needs to move beyond notebooks and into business systems.
How Do You Conduct Statistical Analysis with Python?
- Statistical analysis turns patterns into evidence.
- After cleaning and exploring the data, the next step is often testing ideas more formally.
- Python for data analysis is useful here because it supports both simple and advanced methods that help analysts move from observation to stronger conclusions.
- Instead of only saying that something “looks different,” you can start measuring how strong that difference really is.
- Descriptive statistics usually come first.
- These include averages, medians, standard deviations, ranges, and frequency counts.
- They summarize what is happening in the data without trying to generalize beyond it.
- This is often the first layer of statistical thinking in Python for data analysis, and it provides essential context before deeper tests begin.
- Inferential statistics help analysts draw conclusions beyond the sample they are viewing.
- This may include testing whether one group differs significantly from another, whether a relationship is likely meaningful, or whether a result could be due to chance.
- These methods matter because many business questions are really questions about confidence and decision risk.
- Strong data analysis using python supports that process clearly.
- Correlation analysis is often a useful starting point.
- It helps measure whether two variables move together.
- A positive relationship may suggest that as one variable increases, the other tends to increase too.
- A negative one suggests the opposite.
- This does not prove causation, but it helps guide further analysis and next questions.
- Regression is another major technique.
- Regression helps estimate how one or more variables relate to an outcome.
- It is useful in forecasting, trend estimation, pricing analysis, marketing performance, and risk modeling.
- Because regression is so common across analytics roles, it is one reason many professionals choose Python for data analysis over less flexible tools.
- Analysts who know python programming can often move from simple summaries into stronger predictive reasoning with much more confidence.
- Python’s ecosystem makes this easier.
- Libraries for statistics and modeling reduce much of the manual effort involved in traditional workflows.
- For more advanced tasks, python’s scikit-learn package helps with preprocessing, modeling, evaluation, and experimentation.
- That is especially useful for analysts who want to grow into data science or study machine learning in the future.
- Hypothesis testing is common in business analytics.
- A team may want to know whether a campaign improved results, whether a new product page changed behavior, or whether one region performs differently from another.
- Statistical testing gives a more disciplined way to answer these questions.
- In Python for data analysis, these methods can be applied efficiently across many business use cases, from operations to product decisions.
- Statistical work should always be connected back to the business question.
- It is easy to run tests without explaining why they matter.
- Strong analysts do more than calculate p-values or coefficients.
- They explain what the results mean, how much confidence to place in them, and what action should follow.
- That is what makes Python for data analysis valuable in practice, not just in theory.
- This is also where the broader career path becomes clearer.
- A reporting-focused analyst may use statistics to strengthen dashboards.
- A data engineer may support pipelines that deliver analysis-ready information.
- A more research-focused analyst may move toward experimentation and prediction.
- In each path, Python for data analysis builds a bridge between business understanding and technical depth.
How Do You Visualize Data in Python?
- Data visualization helps turn analysis into understanding.
- Numbers alone can be difficult to interpret, especially for non-technical readers.
- Python for data analysis becomes much more powerful when results are presented visually in a clean and thoughtful way.
- Good visuals do not just decorate results; they explain them.
- The first rule of visualization is choosing the right chart for the question.
- A line chart is useful for trends over time.
- A bar chart works well for comparing categories.
- A histogram helps show distribution.
- A scatter plot is often best for relationships between two variables.
- Matching the chart to the question is a basic but essential part of Python for data analysis.
- Clarity should always come before complexity.
- A simple chart with a strong label often communicates better than a complicated visual with too many elements.
- Readers should understand the main point quickly.
- This matters in business settings where decision-makers may only spend a short time reviewing output.
- Visualization is especially valuable during exploration.
- Charts help reveal skewed distributions, unusual spikes, seasonal patterns, and possible outliers.
- They can also show whether one segment behaves differently from another.
- In many cases, Python for data analysis becomes easier and faster once the data is visualized early in the process.
- Visualization also supports communication across teams.
- Analysts often work with managers, marketers, finance teams, researchers, developers, or operations leaders.
- Not all of them read tables comfortably.
- A well-made chart can help everyone understand the same result.
- That makes Python for data analysis useful far beyond technical departments.
- Good visuals are also repeatable.
- Once a reporting workflow is built, charts can be refreshed with new data.
- This is useful for regular reporting, performance reviews, and recurring dashboards.
- It also connects well with open source tools, automation, and collaborative workflows.
- Visual storytelling is a real skill.
- The point is not just to show all available data.
- The point is to highlight what matters most.
- Strong charts help people see comparisons, movement, exceptions, and opportunities.
- That is why Python for data analysis is so important in modern teams that rely on data-driven communication.
Struggling with Your Data Analysis or Dissertation Statistics?
Get expert assistance with your data analysis projects or dissertation statistics from Best Dissertation Writers . Our team specializes in providing dissertation statistics help , ensuring accurate, well-analyzed results tailored to your research needs. Visit our site to get professional guidance and elevate the quality of your data-driven projects.
Get Professional HelpWhat Does a Real-World Example of Data Analysis with Python Look Like?
- A realistic example helps show how the full workflow comes together.
- Imagine a retail company wants to understand why monthly online sales changed over the last year.
- The team has transaction files, customer segments, marketing data, and website activity.
- This is a strong use case for Python for data analysis because the problem involves multiple sources, messy structure, and both business and technical questions.
- Step 1: Gather the relevant files and records.
- The analyst combines transaction exports, campaign data, and website metrics.
- Some data comes from databases, some from csvs, and some may even come from lightweight web scrapping when public comparison data is needed.
- This first step often reveals missing values, inconsistent naming, and duplicate records.
- Step 2: Clean the data before interpretation.
- Product names are standardized.
- Duplicate transactions are removed.
- Date formats are aligned.
- Missing campaign fields are reviewed.
- This is where Python for data analysis saves major time, especially compared with fully manual workflows.
- Step 3: Explore the patterns.
- Sales are grouped by month, region, and product category.
- The analyst finds that overall revenue stayed flat, but one region fell sharply while another grew.
- Customer segments also behaved differently.
- New visitors converted poorly compared with returning customers.
- This is where data analysis using python begins turning scattered information into business meaning.
- Step 4: Add statistical depth.
- The analyst checks whether changes in traffic, discounting, or campaign performance relate to sales shifts.
- A regression model helps estimate which factors have the strongest association with revenue changes.
- This does not solve everything, but it gives stronger evidence than simple observation alone.
- Step 5: Visualize and report the results.
- Clean charts show the sales decline by region, the change in conversion rate, and the relationship between discount level and performance.
- The analyst presents a short narrative with evidence and action points.
- That output is often more useful to the business than raw tables alone.
- Step 6: Recommend action.
- Based on the findings, the company may revise campaign targeting, review pricing in one region, and improve onboarding for new customers.
- This is what makes Python for data analysis so valuable: it supports better decisions, not just better spreadsheets.
- This kind of workflow appears across many industries.
- In marketing, operations, finance, logistics, product, and customer analytics, the pattern is similar.
- Clean the input, explore the structure, test the important ideas, and communicate what matters.
- That is why so many teams rely on Python for data analysis rather than limiting themselves to one dashboard tool or manual reporting process.
What Challenges Might You Face in Python for Data Analysis?
- One challenge is the initial learning curve.
- Beginners often understand the business question before they feel confident with code.
- Learning syntax, structure, and libraries can feel overwhelming at first.
- This is especially true for people moving from spreadsheet-only roles into programming-based analytics.
- Another challenge is deciding what to learn first.
- There are many tools, packages, and paths available.
- Some people start with notebooks, others with an IDE, and others by comparing r and python or python and r before committing to a direction.
- The best approach is usually to focus on core skills first instead of trying to learn everything at once.
- Version and environment issues can also cause frustration.
- A project may behave differently depending on package compatibility or python version.
- This is why setup discipline matters.
- Even experienced analysts sometimes lose time to environment problems instead of analysis itself.
- Messy business data is often more difficult than the code.
- Real files may be incomplete, inconsistent, or poorly documented.
- Working with big data can create performance issues.
- Even when the tools are correct, the source material may still be difficult to trust or interpret.
- It can also be hard to connect analysis to action.
- A technically correct result is not always a useful business result.
- Analysts sometimes spend too much time on detail and not enough time explaining meaning.
- Python for data analysis is most powerful when technical output is translated into business relevance.
- Career confusion is another common challenge.
- Some people wonder whether they should focus on analyst skills, data science, web development, or engineering paths.
- Others ask whether they need to move toward machine learning immediately.
- The truth is that Python for data analysis is valuable across all these paths, even before specialization.
What Are the Best Practices for Data Analysis with Python?
- Start with the question, not the code.
- Every project should begin with a clear objective.
- Good analysts ask what decision the work is meant to support and what success looks like.
- Keep your workflow organized.
- Use clear file names, logical folder structures, and readable notebooks or scripts.
- Version your work carefully and document important assumptions.
- Shared environments benefit greatly from tools like github.
- Write clean, understandable code.
- Even if you work alone, readable logic saves time later.
- Clear naming, simple transformations, and short explanations make analysis easier to maintain.
- Professionals who know python programming well usually stand out not because their code is clever, but because it is clear.
- Validate your assumptions early.
- Check whether the data covers the right time period, whether the fields are complete, and whether totals make sense.
- Avoid building complex logic on top of broken input.
- Document what you changed during cleaning.
- If rows were removed, categories merged, or values corrected, record that clearly.
- This improves trust and reproducibility.
- Use the right tool for the right stage.
- SQL may be best for extraction.
- Python may be best for transformation and analysis.
- Dashboards may be best for ongoing monitoring.
- Some teams may still compare r for data analysis against Python for certain tasks, but Python for data analysis remains especially strong because it connects analysis, automation, and modeling in one ecosystem.
- Focus on communication, not only computation.
- The goal is to help people understand what matters.
- Strong charts, concise summaries, and practical recommendations make your work more valuable.
- Build skills progressively.
- Learn core analysis before jumping too quickly into advanced modeling.
- Once the basics are solid, it becomes easier to expand into automation, experimentation, and machine learning.
- This path works especially well for analysts who later want to become a data engineer, analyst-developer hybrid, or more advanced modeler.
How Can Python for Data Analysis Benefit Your Career as a Data Analyst?
- Python for data analysis can make you more effective in your current role.
- You can automate repetitive work, improve data quality, and handle more complex requests with confidence.
- This makes you faster, more independent, and more valuable to your team.
- It can also make your profile more competitive.
- Many employers now expect analysts to work with code, not only dashboards and spreadsheets.
- A data analyst with python often has a stronger advantage when applying for roles in analytics, operations, marketing, finance, and product teams.
- It opens paths into adjacent fields.
- Once you are comfortable with Python for data analysis, it becomes easier to move toward data science, experimentation, forecasting, or machine learning.
- You may also work more closely with analysts, engineers, and product teams on larger technical projects.
- It supports cross-functional credibility.
- Teams trust analysts who can explain both the business context and the technical method.
- If you can clean data, evaluate patterns, and communicate clearly, you become more than a report builder.
- You become a problem solver.
- It encourages long-term growth.
- Learning Python for data analysis helps you build habits that transfer well into other areas, including automation, engineering support, model evaluation, and research workflows.
- It also gives you access to a large ecosystem of open source tools and community knowledge.
- It future-proofs your skill set.
- As organizations collect more data and expect faster decisions, analysts who can work efficiently across messy sources, repeated reports, and technical workflows will continue to stand out.
- That is why Python for data analysis is not just a tool skill.
- It is a career skill.
Conclusion
- Python for data analysis is one of the most practical and valuable skills a modern analyst can build.
- It helps you clean messy information, explore trends, perform stronger analysis, create clear visuals, and turn data into action.
- From simple reporting tasks to deeper modeling work, it supports a full workflow that grows with your career.
- The real strength of Python for data analysis is not just technical power, but flexibility.
- It works across industries, data sizes, and business questions.
- It connects well with statistics, automation, dashboards, engineering workflows, and future machine learning goals.
- Whether you are just starting or looking to level up, Python for data analysis gives you a strong foundation.
- For any data analyst who wants to work more efficiently and create more impact, learning this skill is a smart move.
- Start with the basics.
- Practice on real projects.
- Focus on clarity, quality, and business meaning.
- Over time, Python for data analysis can help you move from simply reading numbers to truly leading decisions with data.
References
- Data Analysis Guide – Georgetown University Library – https://guides.library.georgetown.edu/data-analysis
- 5 Key Reasons Why Data Analytics Is Important for Business – University of Pennsylvania – https://lpsonline.sas.upenn.edu/features/5-key-reasons-why-data-analytics-important-business
- 10 Easy Data Analysis Methods and Techniques – Isenberg School of Management – https://iconnect.isenberg.umass.edu/blog/2024/06/06/10-easy-data-analysis-methods-and-techniques/
- Using Data for Analysis – Georgia Tech Library – https://libguides.library.gatech.edu/usingdata/analyzing-data