

Cross-sectional Study Example in Nursing: Staffing, Education and Mortality
 By Dr. Robertson Prime, Research Fellow
Updated October 12, 2026
14 min read
On this page
This cross-sectional study example is the RN4CAST study by Aiken and colleagues, published in The Lancet in 2014. It asked whether hospitals where nurses care for more patients, and where fewer nurses hold a bachelor’s degree, have higher death rates after common surgery. It remains one of the most cited nursing workforce studies, and it shows clearly how a cross-sectional design can link existing data sets to answer a question that could never be tested experimentally.
This cross-sectional study example follows the study from question to conclusion: how hospitals, nurses and patients were selected, how each variable was measured, how the analysis dealt with differences between hospitals and countries, what was found, and which limitations come from the cross-sectional design itself. The final sections show how to use the same approach on a dissertation scale.
Nurse staffing and education and hospital mortality in nine European countries: a retrospective observational study
Aiken, L.H., Sloane, D.M., Bruyneel, L. et al. (2014). The Lancet, 383(9931), pp. 1824–1830. doi.org/10.1016/S0140-6736(13)62631-8
This cross-sectional study example at a glance
- Aim
- To test whether nurse workload and nurse education are associated with inpatient death after common surgery
- Design
- Retrospective, cross-sectional observational study
- Countries
- Belgium, England, Finland, Ireland, the Netherlands, Norway, Spain, Sweden and Switzerland
- Hospitals
- 300 adult acute hospitals
- Nurses
- 26,516 nurses surveyed in 2009–2010
- Patients
- 422,730 surgical patients aged 50 or over, from discharge data for 2007–2009
- Outcome
- Death in hospital within 30 days of admission
- Analysis
- Generalised estimating equations, adjusted for patient, hospital and country characteristics
Research question of the cross-sectional study example
Are hospital nurse staffing levels and the proportion of nurses with a bachelor’s degree associated with 30-day inpatient mortality among surgical patients in nine European countries?
Expected direction: more patients per nurse associated with higher mortality; a higher proportion of bachelor’s-educated nurses associated with lower mortality.
The question in this cross-sectional study example compares hospitals, not individual nurses or patients. That choice shapes every later step: nurse survey answers are averaged to describe each hospital, and patient outcomes are analysed with methods that account for patients being grouped within hospitals.
Why the design fits this cross-sectional study example
- No manipulation possible. Researchers cannot ethically assign hospitals to unsafe staffing, so observing natural variation is the realistic option.
- Large scale at low cost. One wave of nurse surveys plus existing discharge data covered 300 hospitals and over 400,000 patients.
- Wide natural variation. Staffing and education differ greatly between European hospitals and countries, which gives the analysis enough contrast to detect associations.
- Fast answer to a policy question. Governments were cutting hospital costs; a cross-sectional study could inform that debate without waiting years for a cohort to be followed.
Methods of the cross-sectional study example
Hospitals and nurses
In Sweden, Norway and Ireland nearly all adult acute hospitals took part. In the other countries, geographically representative samples of hospitals were selected across regions. Within each hospital outside Sweden, adult medical and surgical wards were selected at random and every nurse giving direct care on those wards was invited to complete the survey; Sweden surveyed medical-surgical nurses nationally. Germany, Poland and Greece took part in the wider RN4CAST project but were excluded from this analysis because comparable discharge data were not available.
Response rates ranged from just under 40% in England to nearly 84% in Spain, with an average of 63% across the nine countries.
| Country | Hospitals | Country | Hospitals |
|---|---|---|---|
| Belgium | 59 | Norway | 28 |
| England | 30 | Spain | 16 |
| Finland | 25 | Sweden | 62 |
| Ireland | 27 | Switzerland | 31 |
| Netherlands | 22 | Total | 300 |
Patients
Patients were included if they were aged 50 or over, stayed in hospital for at least two days and had a common general, orthopaedic or vascular operation, with complete data. Of the 422,730 patients analysed, 52.1% had orthopaedic surgery, 38.6% general surgery and 9.3% vascular surgery. Hospitals needed at least 100 eligible patients to be included, so that each hospital’s mortality figure was based on enough cases.
How each variable in the cross-sectional study example was measured
| Variable | Role | Measurement |
|---|---|---|
| Nurse staffing | Exposure | Each nurse reported the number of patients and nurses on their ward on their last shift. A patient-to-nurse ratio was calculated per nurse and averaged for each hospital |
| Nurse education | Exposure | Percentage of each hospital’s surveyed nurses whose highest qualification was a bachelor’s degree or higher |
| 30-day mortality | Outcome | Death in hospital within 30 days of admission, from discharge records |
| Patient risk | Adjustment | Age, sex, emergency or elective admission, 43 surgery-type categories and 17 comorbidities present on admission |
| Hospital characteristics | Adjustment | Bed size, teaching status, high technology (open heart surgery or organ transplantation) and country |
In this cross-sectional study example, measuring staffing through nurses’ own reports of their last shift is a practical solution to a common problem: official staffing figures often include managers and staff who do not give direct care. Asking about one specific, recent shift also keeps recall short and concrete.
| Country | Patients per nurse (mean) | Bachelor’s-educated nurses (mean %) |
|---|---|---|
| Belgium | 10.8 | 55 |
| England | 8.8 | 28 |
| Finland | 7.6 | 50 |
| Ireland | 6.9 | 58 |
| Netherlands | 7.0 | 31 |
| Norway | 5.2 | 100 |
| Spain | 12.7 | 100 |
| Sweden | 7.6 | 54 |
| Switzerland | 7.8 | 10 |
| All hospitals | 8.3 | 52.1 |
The table shows why a multi-country sample was valuable in this cross-sectional study example. Patients per nurse ranged from 3.4 to 17.9 across hospitals, and the share of bachelor’s-educated nurses ranged from 0% to 100%. That spread gives the analysis the contrast it needs.
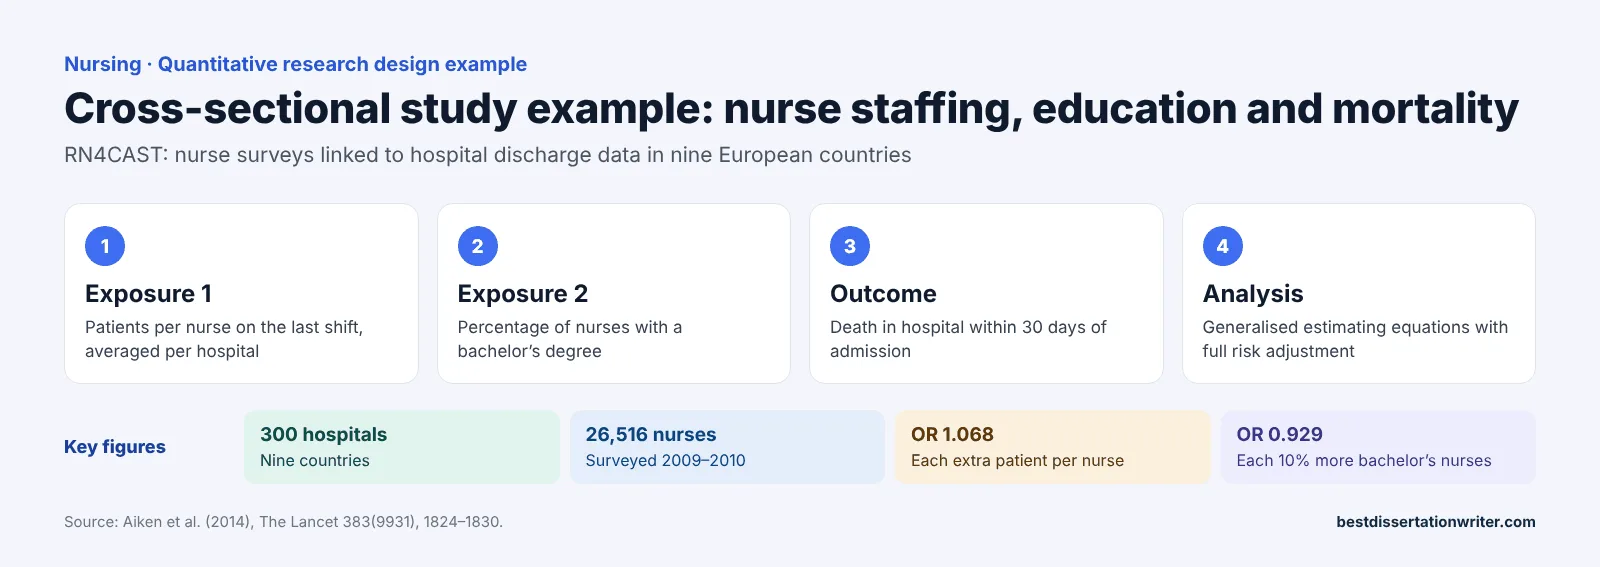
How the cross-sectional study example handled differences between hospitals
- Accounting for clusteringPatients in the same hospital share staff and systems, so their outcomes are not independent. Generalised estimating equations were used to allow for patients being grouped within hospitals.
- Adjusting for patient riskAge, sex, admission type, surgery type and comorbidities were included, so that hospitals treating sicker patients were not unfairly compared.
- Adjusting for hospital and countryBed size, teaching status, technology and country were added. Country dummies controlled for differences between national health systems.
- Partial and full modelsResults were reported first with partial adjustment and then with full adjustment, showing how the associations changed once all factors were included.
- Checking robustnessHierarchical models with random intercepts were also run and gave virtually identical results. An interaction between staffing and education was tested and was not significant.
Key results of the cross-sectional study example
Overall, 5,381 of the 422,730 patients died in hospital within 30 days of admission, about 1.3%. Crude mortality ranged from 1.02% in Sweden to 1.49% in the Netherlands.
| Factor | Partially adjusted OR (95% CI) | Fully adjusted OR (95% CI) |
|---|---|---|
| Each additional patient per nurse | 1.005 (0.965–1.046) | 1.068 (1.031–1.106) |
| Each 10% increase in bachelor’s-educated nurses | 1.000 (0.959–1.044) | 0.929 (0.886–0.973) |
Higher odds of death within 30 days of admission, after full adjustment.
Lower odds of death within 30 days of admission, after full adjustment.
The authors illustrated the combined effect: patients in hospitals where 60% of nurses held a bachelor’s degree and nurses cared for an average of six patients would have almost 30% lower mortality than patients in hospitals where 30% held a degree and nurses cared for eight. The figure comes from combining the two odds ratios: two fewer patients per nurse and 30 percentage points more bachelor’s nurses give a factor of about 0.70.
One detail of this cross-sectional study example is especially instructive for students. Neither factor was significant in the partially adjusted models, and both became significant only after full adjustment. This shows why careful control of confounding matters in a cross-sectional study: hospitals and countries differ in many ways, and those differences can hide or exaggerate an association.
Reading the odds ratios
Odds ratios are where many students lose confidence, so it is worth working through this cross-sectional study example slowly. An odds ratio of 1.068 for staffing means that, with everything else in the model held constant, each additional patient per nurse multiplies the odds of death by 1.068: an increase of about 7%. The 95% confidence interval of 1.031 to 1.106 does not include 1, which is why the result is statistically significant.
For education, the odds ratio of 0.929 for each 10-percentage-point increase in bachelor’s-educated nurses means the odds of death fall by about 7% for each step. The interval of 0.886 to 0.973 lies wholly below 1.
The “almost 30% lower mortality” illustration combines the two. Moving from eight to six patients per nurse is two steps, so the odds are divided by 1.068 twice. Moving from 30% to 60% bachelor’s-educated nurses is three steps, so the odds are multiplied by 0.929 three times. The result, 1 ÷ 1.068² × 0.929³, is about 0.70, meaning roughly 30% lower odds. Showing a calculation like this in your own results chapter makes your interpretation transparent.
Limitations of the cross-sectional study example
| Limitation reported | Why it matters |
|---|---|
| Cross-sectional design | Shows association, not cause; staffing and outcomes were observed over the same broad period |
| Years not perfectly aligned | Discharge data (2007–2009) and nurse surveys (2009–2010) came from slightly different years |
| No link between individual nurses and patients | Hospital averages are used, so the study cannot say which nurses cared for which patients |
| Unmeasured confounding | Other individual, hospital or community factors may explain part of the association |
| Different definitions of a bachelor’s degree | Nursing education systems vary between countries |
| One outcome and common surgery only | Findings need replication for medical patients and higher-risk surgery |
What the cross-sectional study example concluded
The authors concluded that hospitals with fewer patients per nurse and a higher proportion of bachelor’s-educated nurses had lower mortality after common surgery. They argued that staffing cuts made to save money could harm patients, and that a greater emphasis on bachelor’s education for nurses could reduce preventable hospital deaths. Their language stays appropriately cautious, describing associations and calling for replication.
Using this cross-sectional study example in your dissertation
Few students can survey 26,000 nurses, but the logic of this cross-sectional study example works on a small scale. A dissertation version might survey registered nurses in one hospital about their last shift and link the answers to ward-level outcomes or to nurse-reported outcomes such as missed care. Our correlational research question example on staffing and missed nursing care shows a question built for exactly that kind of study.
| Feature of RN4CAST | Dissertation-scale version |
|---|---|
| Survey of nurses about their last shift | Short anonymous survey of nurses on several wards |
| Linking to discharge data | Linking to ward-level audit data, or measuring the outcome in the same survey |
| Adjustment for patient and hospital factors | Controlling for ward, shift type and experience in a regression model |
| Partial and full models | Reporting unadjusted and adjusted results side by side |
| Explicit limitations | A limitations table tied to the design |
“A cross-sectional design was used to examine the association between nurse staffing and [outcome] at a single point in time. All registered nurses on [number] adult wards were invited to complete an anonymous survey reporting the number of patients and nurses on their last shift. Patient-to-nurse ratios were calculated for each respondent and averaged by ward. Associations were estimated using regression models, first unadjusted and then adjusted for ward characteristics, shift type and nurse experience.”
Questions an examiner might ask, and how this cross-sectional study example answers them
- Why not follow patients over time?
- The question was about hospital-level staffing and outcomes; existing discharge data and one survey wave answered it quickly and at scale.
- How do you know sicker patients were not driving the result?
- Models adjusted for age, sex, admission type, 43 surgery types and 17 comorbidities.
- Are hospitals in different countries comparable?
- Country was included in the models, so comparisons are effectively made within the same health system.
- Why should we trust nurses’ reports of staffing?
- Nurses described a specific recent shift, and answers were averaged across many nurses per hospital.
- Is the analysis sensitive to method?
- Hierarchical models gave virtually identical results to the main models.
- Does staffing cause deaths?
- The design cannot show this; the authors describe associations and call for replication.
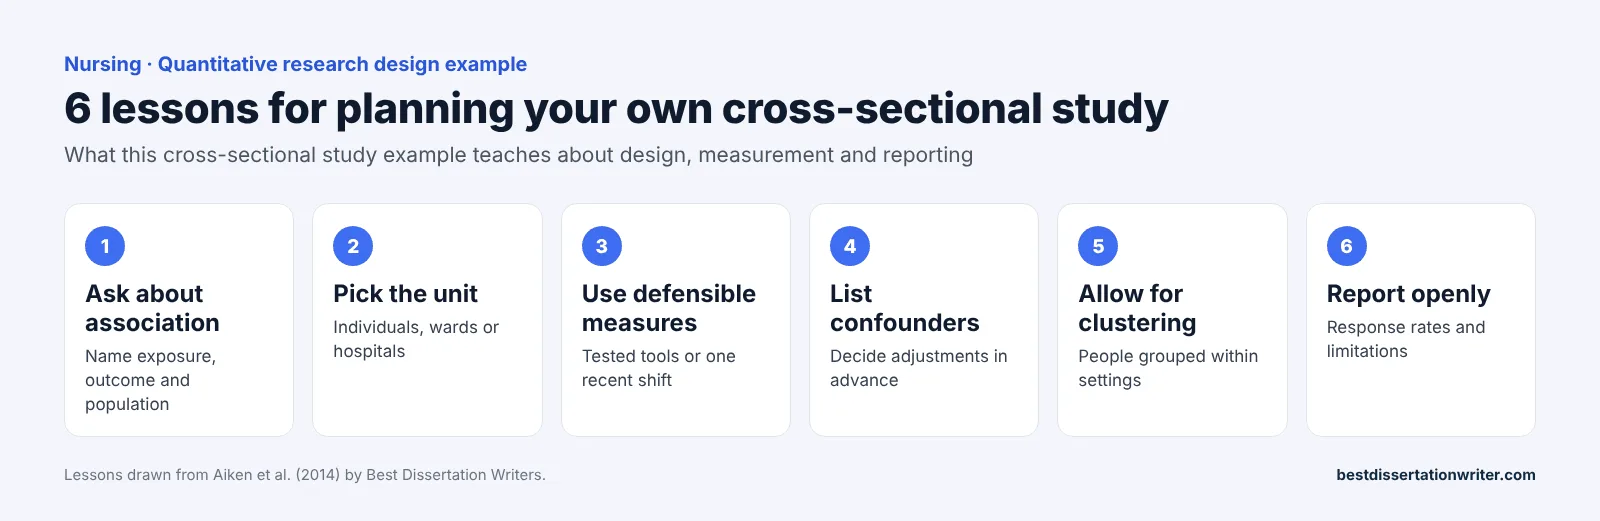
Planning your own cross-sectional study: a checklist
- Write the question as an associationName the exposure, the outcome and the population, and avoid causal verbs.
- Define the unit of analysisDecide whether you are comparing individuals, wards or hospitals, and collect data at that level.
- Choose measures you can defendUse tested instruments or specific, recent reference periods such as “your last shift”.
- List confounders in advanceDecide which factors to adjust for before you see the data.
- Plan for clusteringIf people are grouped within wards or hospitals, use an analysis that allows for it.
- Report response rates and limitationsMake non-response and the one-time nature of the data visible to the reader.
Sample size for a smaller cross-sectional study example
RN4CAST could detect modest associations because it included hundreds of thousands of patients. A dissertation will be far smaller, so the sample size must be planned for the analysis you intend to run. For a regression model, power software such as G*Power uses the expected effect size, the number of predictors, the significance level and the desired power to estimate the minimum number of participants. If your available population is smaller than the estimate, either reduce the number of predictors, accept lower power and say so, or present the study as a pilot that estimates effect sizes for a larger study.
Report the calculation in your methods chapter, along with the number of people invited, the number who responded and the response rate. Readers judge a cross-sectional study partly on how well its respondents represent the population, so the response rate belongs in the main text rather than an appendix.
Ethics and data protection on a smaller scale
A cross-sectional survey of staff looks low-risk, but it still needs careful planning. If nurses report staffing levels or care left undone, they may worry about being identified, so collect no names, avoid small categories such as rare job titles, and only report ward-level results where enough people responded. If you link survey answers to routine data, such as ward audits or incident figures, explain in the information sheet exactly what will be linked and at what level, and check the hospital’s data governance rules before applying for ethical approval. Keep the data on an encrypted, university-approved drive and state how long it will be kept.
How to describe this cross-sectional study example in your literature review
“In a cross-sectional study of 300 hospitals in nine European countries, Aiken et al. (2014) linked survey data from 26,516 nurses with discharge data for 422,730 surgical patients. After adjustment for patient, hospital and country characteristics, each additional patient per nurse was associated with a 7% increase in the odds of inpatient death within 30 days, and each 10% increase in bachelor’s-educated nurses with a 7% decrease. Although the design cannot establish causation, the size of the sample and the consistency of the findings make it a key source on nurse staffing and patient safety.”
Notice that the paragraph names the design, gives the sample, reports the adjusted result in plain words and ends with a judgement that acknowledges the main limitation. That pattern works for any quantitative study you summarise.
Related examples and reviews
Workforce questions connect several parts of our library. Our literature reviews on burnout and staff wellbeing and early warning scores look at staff pressure and patient deterioration from different angles. To see how a survey can be followed by interviews that explain its results, read the explanatory sequential design example, and for the experience of nurses working under extreme pressure see the phenomenology example.
Common mistakes this cross-sectional study example avoids
- Causal wording. The title and conclusions describe associations, and the authors call for replication.
- Ignoring clustering. Patients are grouped within hospitals, and the analysis allows for it.
- Reporting only adjusted results. Showing partial and full models lets readers see how adjustment changed the findings.
- Vague exposure measures. Staffing is measured from a specific shift, not from general impressions.
- Hiding the response rate. Response rates are reported for every country.
Use this cross-sectional study example as a model for structure as well as method: question, sample, measures, analysis, results, limitations and conclusions, each reported in turn.
- State the time frame of data collection clearly; a cross-sectional study is a snapshot.
- Name your exposure, outcome and adjustment variables in a table.
- Report associations with confidence intervals, not just p values.
- Show unadjusted and adjusted results.
- Use association language in your conclusions.
This cross-sectional study example summarises a published study in our own words to show how the design is used in practice. Figures are taken from the authors’ accepted manuscript. Read the original article for full methods and results.
References
- Aiken, L.H., Sloane, D.M., Bruyneel, L., Van den Heede, K., Griffiths, P., Busse, R. et al. (2014) Nurse staffing and education and hospital mortality in nine European countries: a retrospective observational study. The Lancet, 383(9931), pp. 1824–1830. https://doi.org/10.1016/S0140-6736(13)62631-8
Cite this example
Best Dissertation Writers (2026) Cross-sectional Study Example in Nursing: Staffing, Education and Mortality. Available at: https://bestdissertationwriter.com/cross-sectional-study-example-nursing-staffing/
Best Dissertation Writers
Need a Cross-sectional example for your own project?
Share your topic and deadline with Best Dissertation Writers and get expert support tailored to your brief.